Hammond hits 1.618 fibHammond is my largest single stock holding for obvious reasons. We just hit the 1.618 fib, I have been searching heavily for any pullbacks on this stock and we simply arent getting them. Analysts are now projecting 170$ targets. If we are going to pull back it should be around now since this is a ve
Next report date
—
Report period
—
EPS estimate
—
Revenue estimate
—
3.0EUR
43.34 MEUR
485.39 MEUR
8.85 M
About HAMMOND POWER SOLUTIONS INC
Sector
Industry
CEO
Adrian Thomas
Website
Headquarters
Guelph
Employees (FY)
1.88 K
Founded
1917
FIGI
BBG01GM8LBL0
Hammond Power Solutions, Inc. engages in the design, manufacture, and sale of dry-type power distribution transformers. Its products include control and automation, low voltage distribution, medium voltage distribution and power, and potted and specialty. The firm serves the oil and gas, steel, waste and water treatment, and wind power generation industries. The company was founded by Oliver Hammond and Len Hammond in 1917 and is headquartered in Guelph, Canada.

Hammond electric vehicle playHammond I covered a few times in the past. This illiquid small cap is a larger player in my portfolio and performed exceptionally well last year. Momentum wise, the stock just confirmed the almighty golden fib. I expect great things from this compounder in the future.
My thesis for this stock revol

Hammond maintaining 52-week highHammond tends to peak RSI around 85 and that area is marked with the dashed green line. This stock has extreme momentum on very strong financial performance. The stock also recently broke a key 500 million dollar market cap. A medium term downtrend was broken as well showing strength both medium and

Hammond broke all-time highsHammond is a thesis I am very excited about, I should write a full article on it. This companies earnings just blew expectations out of the water. The sideways channel is broken and the company is cleared to hit a 1 billion dollar plus market cap which will garner attention. If this stock gets liste

Hammond approaching ATHThis is one of my favorite growth stocks, I find it cheap although its annoying to buy since its mostly OTC indirectly. This could be a potential double top, but this stock doesnt seem to care as it prints new all-time-highs month after month.

Hammond Power falling out of channel but reboundingHammond is my newest long-term position, between their amazing quarterly performance, and the increased need of transformers world-wide, I believe it has a safe moat. TA wise the stock fell out of its exceptional channel and fell below the 20SMA. Looking to reclaim momentum back towards the channel

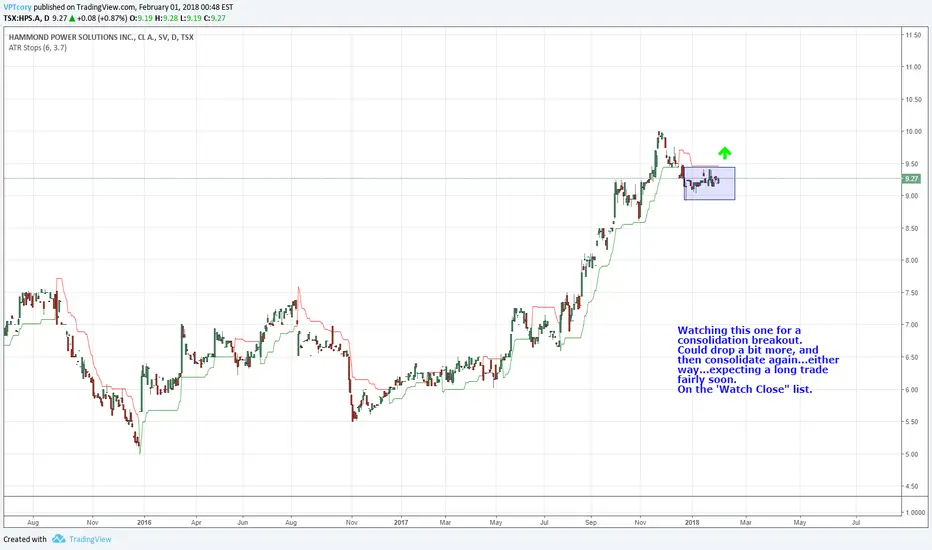
Watching This One Closely HPS.A.TOWatching this one for a consolidation breakout.
Could drop a bit more, and then consolidate again. Either way...expecting a long trade fairly soon.
On the 'Watch Close" list due to a lot of recent momentum and recent price consolidation.
See all ideas
Trade directly on the supercharts through our supported, fully-verified and user-reviewed brokers.


Frequently Asked Questions
The current price of T11 is 69.5 EUR — it has increased by 0.72% in the past 24 hours. Watch HAMMOND POWER SOL.INC.A stock price performance more closely on the chart.
Depending on the exchange, the stock ticker may vary. For instance, on FWB exchange HAMMOND POWER SOL.INC.A stocks are traded under the ticker T11.
HAMMOND POWER SOL.INC.A is going to release the next earnings report on Jul 24, 2024. Keep track of upcoming events with our Earnings Calendar.
T11 stock is 0.72% volatile and has beta coefficient of 0.60. Track HAMMOND POWER SOL.INC.A stock price on the chart and check out the list of the most volatile stocks — is HAMMOND POWER SOL.INC.A there?
T11 earnings for the last quarter are 0.46 EUR per share, whereas the estimation was 0.94 EUR resulting in a −51.09% surprise. The estimated earnings for the next quarter are 1.02 EUR per share. See more details about HAMMOND POWER SOL.INC.A earnings.
HAMMOND POWER SOL.INC.A revenue for the last quarter amounts to 130.45 M EUR despite the estimated figure of 128.62 M EUR. In the next quarter revenue is expected to reach 129.46 M EUR.
Yes, you can track HAMMOND POWER SOL.INC.A financials in yearly and quarterly reports right on TradingView.
T11 stock has fallen by 2.80% compared to the previous week, the month change is a 34.43% fall, over the last year HAMMOND POWER SOL.INC.A has showed a 451.59% increase.
T11 net income for the last quarter is 5.44 M EUR, while the quarter before that showed 13.61 M EUR of net income which accounts for −60.01% change. Track more HAMMOND POWER SOL.INC.A financial stats to get the full picture.
Today HAMMOND POWER SOL.INC.A has the market capitalization of 853.44 M, it has decreased by 21.97% over the last week.
Yes, T11 dividends are paid quarterly. The last dividend per share was 0.10 EUR. As of today, Dividend Yield (TTM)% is 0.54%. Tracking HAMMOND POWER SOL.INC.A dividends might help you take more informed decisions.
HAMMOND POWER SOL.INC.A dividend yield was 0.67% in 2023, and payout ratio reached 10.33%. The year before the numbers were 1.91% and 10.16% correspondingly. See high-dividend stocks and find more opportunities for your portfolio.
Like other stocks, T11 shares are traded on stock exchanges, e.g. Nasdaq, Nyse, Euronext, and the easiest way to buy them is through an online stock broker. To do this, you need to open an account and follow a broker's procedures, then start trading. You can trade HAMMOND POWER SOL.INC.A stock right from TradingView charts — choose your broker and connect to your account.
As of May 11, 2024, the company has 1.88 K employees. See our rating of the largest employees — is HAMMOND POWER SOL.INC.A on this list?
Investing in stocks requires a comprehensive research: you should carefully study all the available data, e.g. company's financials, related news, and its technical analysis. So HAMMOND POWER SOL.INC.A technincal analysis shows the sell today, and its 1 week rating is neutral. Since market conditions are prone to changes, it's worth looking a bit further into the future — according to the 1 month rating HAMMOND POWER SOL.INC.A stock shows the buy signal. See more of HAMMOND POWER SOL.INC.A technicals for a more comprehensive analysis.
If you're still not sure, try looking for inspiration in our curated watchlists.
If you're still not sure, try looking for inspiration in our curated watchlists.
We've gathered analysts' opinions on HAMMOND POWER SOL.INC.A future price: according to them, T11 price has a max estimate of 113.25 EUR and a min estimate of 105.79 EUR. Watch T11 chart and read a more detailed HAMMOND POWER SOL.INC.A stock forecast: see what analysts think of HAMMOND POWER SOL.INC.A and suggest that you do with its stocks.
EBITDA measures a company's operating performance, its growth signifies an improvement in the efficiency of a company. HAMMOND POWER SOL.INC.A EBITDA is 59.44 M EUR, and current EBITDA margin is 13.69%. See more stats in HAMMOND POWER SOL.INC.A financial statements.