UK 100 Short on the dayFor more expert analysis of multiple assets, make sure you click the follow button!
Here we have our 4H FTSE 100 chart.
Today we are looking short on the previous rally.
We are now meeting our MA's again and looking further down for our target (noted with arrow).
UK100 trade ideas

UK100 `` FTSE100Price is at horizontal support, and at lower edge of ascending channel , displaying its bottoms.
However, I don't see strong demand here, price seem to throttling on ?air- not what I expect to see really
I'm herein for long, and should fill in appropriate positions when I see the pressure, also I'm very ready to cut this off- no pressure.

Elliott Wave View: Rally in FTSE Expected to FailShort-term Elliott wave view in FTSE suggests cycle from September 20, 2021 low has ended with wave (1) at 7403.36. The Index is currently correcting that cycle within wave (2). Internal subdivision of wave (2) is unfolding as a zigzag Elliott Wave structure. Down from wave (1), wave ((i)) ended at 7342.61 and rally in wave ((ii)) ended at 7370.01. Index resumes lower in wave ((iii)) towards 7241.99 and bounce in wave ((iv)) ended at 7289.51. Final leg lower wave ((v)) ended at 7198.76 and this completed wave A.
Rally in wave B is in progress to correct cycle from November 12, 2021 high. Internal subdivision of the rally is unfolding as another zigzag in lesser degree. Up from wave A, wave ((a)) ended at 7307.89 and pullback in wave ((b)) ended at 7245.98. Near term, expect the Index to extend higher in wave ((c)) towards 100%-123.6% extension area at 7355.55 – 7381.47 . This should complete wave B in higher degree before the Index turns lower. As far as pivot at 7403.36 high remains intact, expect the rally to fail in 3, 7, or 11 swing for further downside in wave C.

UK100 BUY NOW.......
💹UK100 ⏬BUY @ 7289.5
✅TP # 7344.0
⛔️SL 7240.0
N.B- If have small balance to trade. Plz avoid SILVER trade now.
Because market highly volatile.
📊 Trade Accuracy 80% 📊
📊 Risk Ratio 1:1 📊
📊 Follow Proper M.M & Use S.L 📊
AronnoFX will not accept any liability for loss or damage as a result of
reliance on the information contained within this channel including
data, quotes, charts and buy/sell signals
If you like this idea, do not forget to support with a like and follow.
Traders, if you like this idea or have your own opinion about it,
write in the comments. I will be glad.


UKX Hourly - Bear flag loading After a false break higher out of the upward channel (bearish), the sell off has been relatively quick. Currently a bear flag building. First target is 7185 with lateral support coming in around 7140

Retest of the S+D zone underwayAs I anticipated we are seeing a retest underway of the S+D zone precipitated by fears associated with COVID. We are currently seeing consolidation along the Daily 50 moving average at present which I admit is often a contentious level of dynamic resistance for the FTSE later. However we are beginning to see lower volume in the selling waves on the lower time frames with the 4 hour wave currently underway. Fundamentally our officials have attempted to distance the UK from the possibility from further lockdown and my day job would suggest that we are not near the point of saturating our healthcare resources at present (I monitor this very closely.) Thus my bias is back up.
I will be watching closely for signs of reversal on 15m timeframe. I have popped a small position on the level of the daily 50 and my likely criteria for entry for me will be a break and close above the 15min 21 ema and then wait for the retest of the 8 ema. I will then be looking for price acceptance back above 7240 (4 hour 200 ema) when I will increase my position further. A Close on the 1 hour or 4 hour time frame below 7190 would invalidate this idea for me and I suspect we could see as low as 7000 again.
Keep an eye on the news and trade safe.

Tuesday Pre London / NY session Trade Idea - Update 2Lesson : look left to get right
directional bias is correct focus on prior price action that is more significant for entry level. Watch for liquidity pools and institutional candles

FTSE100 Top Of Structure, Get Ready for Sell opportunities
Hello everyone:
Also looking at FTSE100 for the bearish reversal from the top.
We can see similar higher time frame structure here like other indices market. Price has correct within and have few swing highs and lows.
Latest development shows a lower time frame double tops, smaller ascending structure at the top of the HTF structure, good signs of possible reversals.
Watch for a completion of the ascending structure, and look for bearish reversal on the lower time frame for sell entries down to previous lows.
Thank you

the geometrical drawings say 12653.7 is the maxthe geometrical drawings say 12653.7 is the max and year 2022 by July is the down side
this is not a prediction of the future only God Knows the future but conclusions based on geometrical drawings

Tuesday Pre London / NY session Trade Idea - Update Price playing out accordingly, buy trade activated - waiting for candle stick confirmation on the close of the 4h , 1h , 15min would like to see an institutional candle.

Retest forming on the FTSEIt would appear that a retest of the S+D zone appears to be forming on the FTSE. I am currently maintaining positions @ 7300 as it is possible this may continue along the this short term ascending channel. If there is a break of this channel I expect to see a retest of the S+D zone below @ 7210 - 7260.
This all seems to coincide with the latest COVID fears across Europe and the possibility of restrictions. The FTSE is still significantly undervalued and I feel this is a significantly good entry point to continue back to break the recent high of 7400.
Trade Safe!

UK FTSE 100 Looks BullishOn a downmove since the past few sessions the blue trend lines on the chart shows decreasing prices. Interestingly the volume in correlation to the price again shown by blue trend line shows a decreasing volume. When prices fall on decreasing volume it shows weakness in the trend. We also see a sudden increase in volume on some recent buying candles showing strength. Expect prices to reach 7360 levels in the coming days.

UK100 - Breakout or Correction Imminent?The UK100 has been on a good run in recent weeks, in keeping with the broader trend in stock markets that have reacted very positively to a strong third-quarter earnings season.
This followed an adjustment prior to the start of the season as investors started pricing in earlier and earlier rate hikes, not to mention more of them over the next couple of years, in response to higher inflation signals.
Broadly speaking, they find themselves caught between two opposing forces at the moment. Earnings euphoria and inflation fear which is why in many markets we're only seeing marginal moves and in some, simply treading water and waiting for the next signal.
So for the FTSE to continue making steady, albeit small gains has been encouraging. It has recently run into resistance though at 7,400 which is a notable historic level of support and resistance, as the big round numbers so often are. It was particularly the case in the late summer to early winter period of 2019 when it really struggled to break above here. We all remember what came shortly after.
For the first time since the pandemic, it's trying to break back above here again but it's struggling once more. The MACD and stochastic show it was struggling for momentum in the days leading up to the level and we appear to have since seen some profit-taking.
This begs the question, is a breakout imminent or are we facing a deeper correction after a decent run? That will depend on how the index responds around 7,300-7,320.
Not only is this the next big number down, but it also coincides with the 55/89-period SMA band on the 4-hour chart that has tracked the rally higher, offering support on any pullbacks. A break below here could signal a deeper correction.
A rebound off here could trigger another run at 7,400. If this happens, the momentum indicators will be key. And a failure to make a new high will be another red flag as far as the rally is concerned.

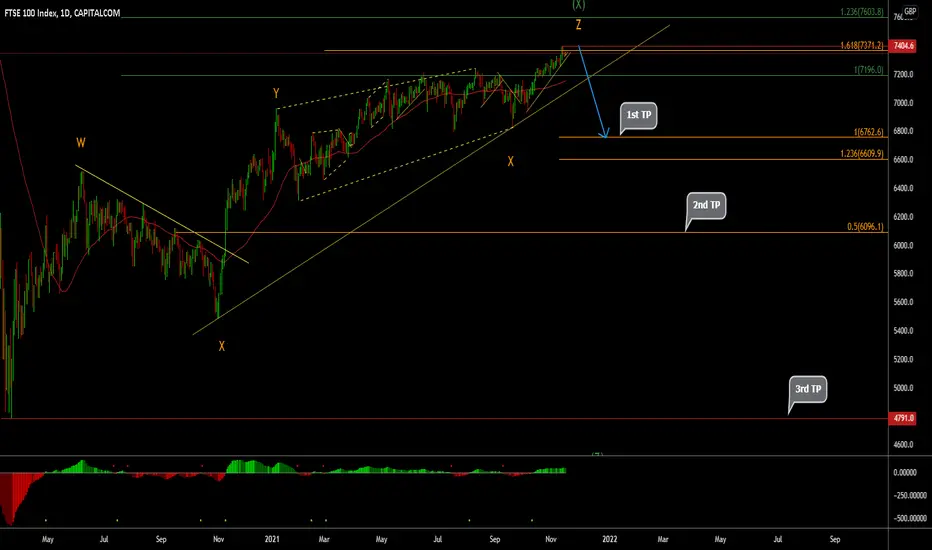
FTSE 100 D1 Longer Term ViewAs explained in detail in the free weekly outlooks , check it out for the complete picture!
W1 Possible bear hidden divergence giving Z down breaking the low.
D1 Theres a couple different scenario's with the ultimate 3rd target.
H1 Looking for sell setups, heres an example of a possible short setup if flag holds but there maybe a few before were on the one that goes.
Good luck and trade safe!
Thanks for taking a look and if you like this idea hit the thumbs up to show your appreciation for this free analysis.
Thank's to all the traders in advance that hit the thumbs for your support!
Enjoy!
UK100 The Next Wave you should not miss (Have patience)Hi there,
UK100 index is setting up for next bullish wave.
Everyone is running after the US stock buy ignoring the UK.
So get ready for the next train on UK100 Index and ride it all the way for the record high.
Good luck
