Us30 tp hitDow Jones had completely nailed our analysis perfectly timed chart work totally pips profit TP hit and extra 150 pips moved with Same as per analysis
US30 trade ideas

Daily Analysis - 04/06/2024 - The Modern Day TraderSpotlight Pair: EURUSD - LONG
- Daily IRL -> ERL
- 4H FVG Has been mitigated
- 1H MMXM failed to for a market structure shift which indicates continuation.
As always, make sure my analysis aligns with your own plan and rules before jumping into positions. Trade Safe!
Sam
The Modern Day Trader

US 30 long - scalp trade (update) Just like that we got the buyside sitting at 38660 as mentioned in the previous idea.
IF you've taken a trade along the way, don't forget to take some profits.
IF you're on the sideline and want to get involved...FOLLOW the market structure and HTF liquidity
Stay safe and never risk more than 1-5% of your capital per trade. The following analysis is merely a price action based analysis and does not constitute financial advice in any form.

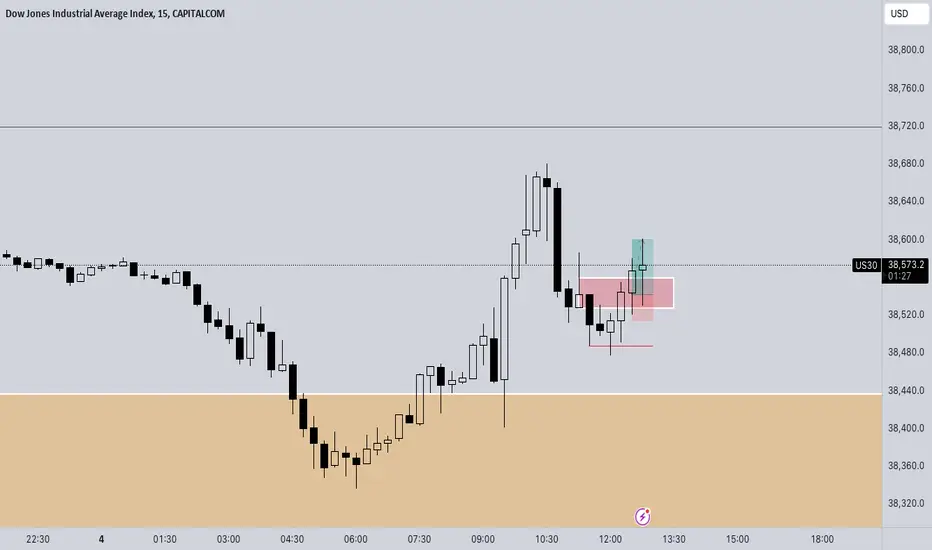
US 30 long - scalp trade Taken a nice scalp long on US 30.
Entry 38541
TP 38600
SL 38515
As long as we hold the FVG expect us to continue higher towards 38660
IF we fail to hold this will be an inverted FVG sending prices towards the HTF sellside (back into the yellow box)
Stay safe and never risk more than 1-5% of your capital per trade. The following analysis is merely a price action based analysis and does not constitute financial advice in any form.
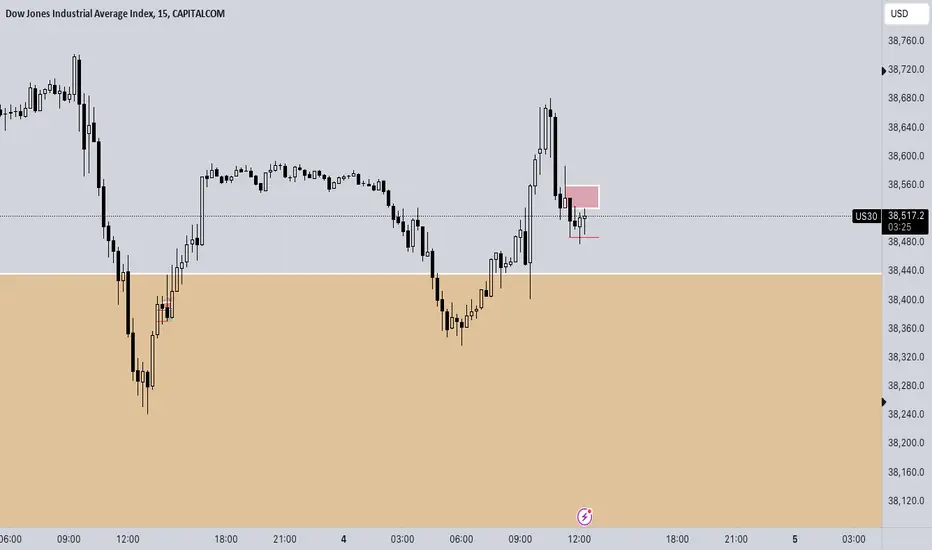
US 30 - Ranges overview We had a nice big range on Monday so let's see where we go from here.
Will be looking to see how we play the 5min FVG (red box) and the 5min sellside (red line)
No need to front run the market...be PATIENT...PLAN and EXECUTE
HTF buyside and sellside liquidity are clear (don't hesitate to zoom out to see it clearly)
Stay safe and never risk more than 1-5% of your capital per trade. The following analysis is merely a price action based analysis and does not constitute financial advice in any form.
Lets make to the top
All ideas are strictly my interpretation of price action. I am not a professional trader nor is this
professional advice.

US30 Intra Week Analysis, June 4th 2024Last week on us30, we saw price begin trading below 39k, clearing the range to 38500 as expected. Then continuing this bearish correction to test key level 38000 before rejecting and ending the week at 38500. On higher time frames us30 is still in a bullish market structure, giving us no reason to change our bullish bias. So unless us30 breaks below 37800 we can expect price to make its way back to 39k as long as we begin trading above 38600 after a potential retest of 38400 or 38000.

Head and shoulders on US30 ??Maybe short time on us30 ? excellent opportunity to short us30. the shape of the head and shoulders is developing nicely

Dow Jones buyUs30 looking for buy side momentum due to its longterm continuation...small Stop-loss 1:2 RR

US30 US30
Tendency the price is a long pressure in between 38,405 and 38,310
Turning level : The turning level between 38,405 and 38,310 so as long as the price above this level, there will be a bullish trend
resistance level : trade above turning level between 38,405 and 38,310 , the price will rise to 38,745 and 38,930
support level : braking a turning level 38,310 the price will reach the support level of 37,940 and 37,720
corrective level : price will attempt between 38,405 and 38,310, correct itself before long

US30 TRADEIt is important that we utilize the higher time frames for direction bias and target the highs or lows where liquidity is found.
ALWAYS trade in the direction of the HTF.
LTF are used to refine your entries.
1. Identify market direction - Daily/4hr chart.
2. Identify your current trading range. -Daily/4hr chart.
3. Get your Fibs retracement tool and draw from the bottom of the range to the top for a bullish market and from the top to the bottom of the range for a bearish market.
4. Identify your discount or premium area.
5. Within your point of interest identify, imbalances, order blocks, fu/ic candles.
Target will be the previous high or low

DOW JONES The bleeding may not be over. How low will it go?On our last Dow Jones (DJI) analysis (May 24, see chart below), we called for the high probability of a bearish break-out below the Channel Down, following the 1D MACD Bearish Cross (similar to April 02):
As you can see, Dow delivered, so our 38350 Target got hit, with minimum losses on the buy position at the bottom of the Channel Up. Yesterday's rejection on the 1D MA50 (blue trend-line) though, is far from ideal and opens the way for more downside.
The chart shows DJI's long-term pattern, which has been a Channel Up since the October 03 2022 market bottom. The periodic corrections through Bearish Legs have both declined by -9.25%, a striking resemblance indeed. Yesterday's 1D MA50 rejection basically resembles those of the past Bearish Legs on March 06 2023 and October 17 2023.
Ahead of the 1D MA50/ 100 Bearish Cross, which could be completed by tomorrow, there is high probability for a deeper Low, at least as Low as Support 1 (37250). This would be ideal as it would also make contact with the 1D MA200 (orange trend-line) for the first time in 7 months (since November 03 2023)!
After that though, we will turn into long-term buyers again, even though that wouldn't complete the -9.25% decline of the previous Bearish Legs, but in terms of R/R would be acceptable enough to aim for 40000 before the Channel Up goes for a Higher High.
-------------------------------------------------------------------------------
** Please LIKE 👍, FOLLOW ✅, SHARE 🙌 and COMMENT ✍ if you enjoy this idea! Also share your ideas and charts in the comments section below! This is best way to keep it relevant, support us, keep the content here free and allow the idea to reach as many people as possible. **
-------------------------------------------------------------------------------
💸💸💸💸💸💸
👇 👇 👇 👇 👇 👇

US30: First green day, three days cycleHi everyone and welcome to my channel, please don’t forget to support all my work subscribing and liking my post, and for any question leave me a comment, I will be more than happy to help you!
“Trade setups, not movements”
1. DAY OF THE WEEK (Failed Breakout, False Break, Range Expansion)
Monday DAY 1 Opening Range ✅ day 3 cycle
Tuesday DAY 2 Initial Balance
Wednesday DAY 3 (reset DAY 1) Mid Point Week
Thursday DAY 2
Friday DAY 3 Closing Range
2. SIGNAL DAY
First Red Day
First Green Day ✅
3 Days Long Breakout
3 Days Short Breakout
Inside Day
3. WEEKLY TEMPLATE
Pump&Dump
Dump&Pump ✅
Frontside ✅
Backside
4. THESIS:
Long: primary, looking for a buy low setup going back to the previous HOW, completing the weekly dump and pump.
Short: secondary, market left a "gap" during the strong momentum push of Friday, I wouldn't exclude a short trade setup during the third hour NY (10am), if a buy low is presented.
Please note that the purpose of my analysis is to help me and you hunting the best trade setup for the day, none of my technical aspects are a way to forecast any directional market movement.
Gianni

US30 longMonthly;
[/b
]There is no clear thesis. Price could go up or down.
Price has not retested the previous all time high. However, that is because it came across a high liquidity area on the weekly.
Weekly;
There are two thing worth noting on the weekly.
One is that price has formed a three pin pattern which might indicate that price is headed downwards
Second, is that the previous week's candle closed above a buy liquidity region at 38,500 and price may be headed upwards.
Currently price looks as if it will close above the 38,500 level and continue upwards.
To get a clear thesis of what is going on, I will have to go to lower timeframes.
Daily;
Monday's candlestick is pretty indecisive.
Two things are happening here.
One, price did not close above 38,630 level which would indicate that price is headed upwards.
Secondly, price has not given a convincing closure below 38,560 which would indicate that price is headed downwards.
Hence, there is no clear thesis on the daily and hence lower timeframe will give a better overall depiction as to where price is headed towards
4 hour;
New York session saw a lot of sell orders from 38,800 to 38,250.
From 38,250, we saw that price gained a rush of bullish momentum and it managed to close well above 38,450.
At the time of posting this, price is showing that it is headed upwards, however, orders are not enough to take it there.
I am waiting for a retest of 38,450 before we go upwards to 38,665
The target is 38,665. This is the target of the -27.2 fib level which is usually a high probability setup.
Moreover, if price closes above 38,800 which is Monday's high, then it is headed to 39,023.5

Short from PremiumsDear Traders,
This is my bias for US30. As we can see that us30 is falling from the top forming double top around 40000 psychological number. I am sharing two ideas as per my analysis. shorting from premium or waiting till it grabs buy side liquidity at premium extreme and falling hard. Bearish momentum is still in consideration as monthly closing pushed market higher. i still think that it can fall up to 37500-37700 area. All the best. This is just an idea. Do not take this as any trading signal. Consider Risk management!!!!

Upward trendThe trend has increased and good entry points can be obtained on this trend line, the previous ceiling can also be the destination


ENTRY ON US30Please do not copywhat I do.
I am being aggressive and not waiting for the perfect set up, I can afford to be wrong.I am willing to risk to see weather I'm right.
My risk management is a little odd, "no risk, no rarri".
IDEALLY
1. Wait for the indicated level to be taken out.
2. Wait for some sort of retracement to the zone or old high.
Please proceed with caution, don't be to eager.
THE IDEA CAN STILL FAIL

New H1 floorIf I didnt know this went all the way down last week I would look for sells in this setup, but because a lot of data is missing, in which it reversed various times, it could become a buyers market and break bullish.
There are a bunch of Key Levels at the current price. Do not like this area.. Period.

Reaching
All ideas are strictly my interpretation of price action. I am not a professional trader nor is this
professional advice.

Daily Analysis - The Modern Day TraderSpotlight Pair: EURUSD Short
- Daily Run of TIme based liquidity (May monthly high)
- 4H/1H Market Maker Model pending the reversal structure which we could see early in the next London session
- I'll be waiting for a M15 Market structure shift to short this pair,
Trade Safe!
- The Modern Day Trader

US30 possible long for 38970accumulation phase around 38150-38800 in 1 hour time frame. demand zone for long 38150-38080, stop loss: 37990, target: 39970

$DJIA M pattern June 2024Dily chart is forming M pattern... A drop is due if the Neck Line is broken..
