FTSE100 GeoTimeUsed major pivots, forks and time here
Expecting bear market to commence next year
Some targets as shown
TRADE AT YOUR OWN RISK
UK100 trade ideas

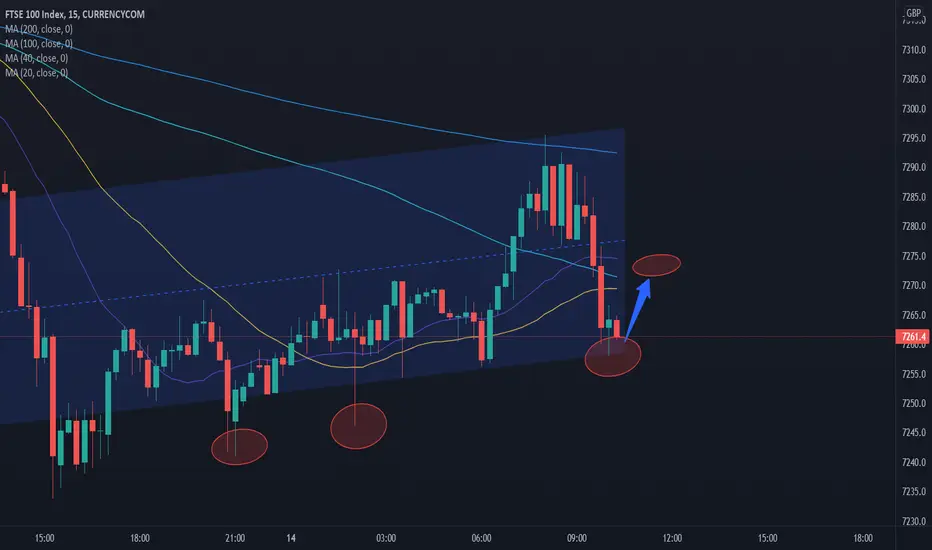
FTSE rebound from the hit.Don't forget to click on the follow button for more daily detailed analysis. Also if you have any questions please do ask them!
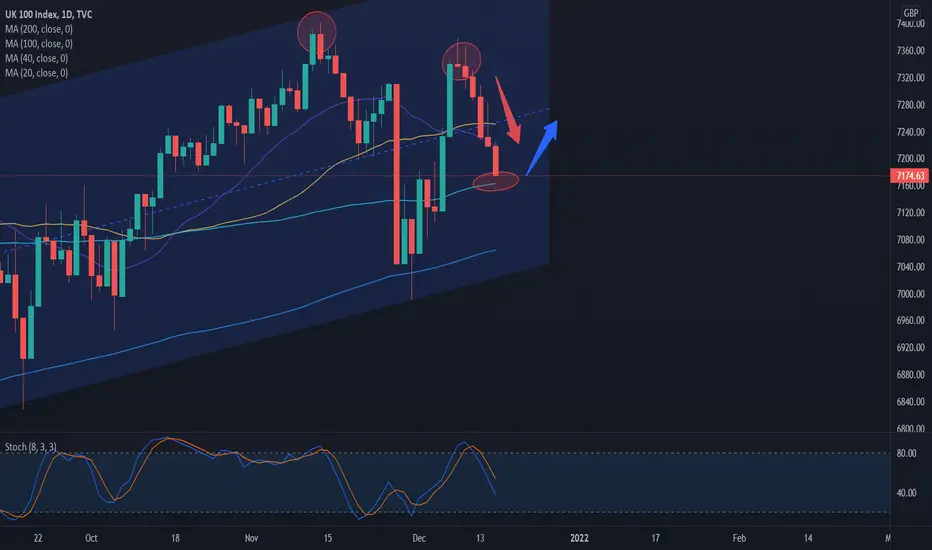
We were previously looking short on the FTSE and our targets were hit. We are now looking long as we fall to comfortable support.
The FTSE was knocked by sentiment around the current covid news and it's affect on the UK economy from a demand shut down.
Long entry comes as TECHs line up. RM will be in focus as sentiment changes. This means keeping an eye accurately on risk and adding.
Directional arrow notes price movement.

Further entry for the road down.It is almost certain that we will see some form of lockdown at this point with the devolved nations and the health secretary laying the groundstone for a circuit-breaker type lockdown.
The current pullback is making for a good entry position following the sell off in the asian market. My target is still around 7050, I don't see this breaking out of this upward trend as a result of this and any further pips would be greed at this point.
My rationale is that the infrastructure is in place for a further lockdown, businesses are already well adapted to these circumstances and I feel that there would have to be another fundamental precipitant to see price action below 7000.
My view on Omicron remains constant. High transmisibillity moderate pathogenicity. This however in a co-morbid population could be dangerous and the forthcoming hospital number spike is inevitable.
Trade Safe. See you at the bottom!

UK100Buy Order placed for a short term buy. UK100 is bearish on a hgher timeframes so this is a short term trade and should be managed carefully.

FTSE to dip..For more daily detailed analysis, don’t forget to click on the following button. Also, please ask any questions you may have and I will be happy to answer them.
Recently, we looked long to our current targets. Sentiment from the CB meeting drove price nicely up.
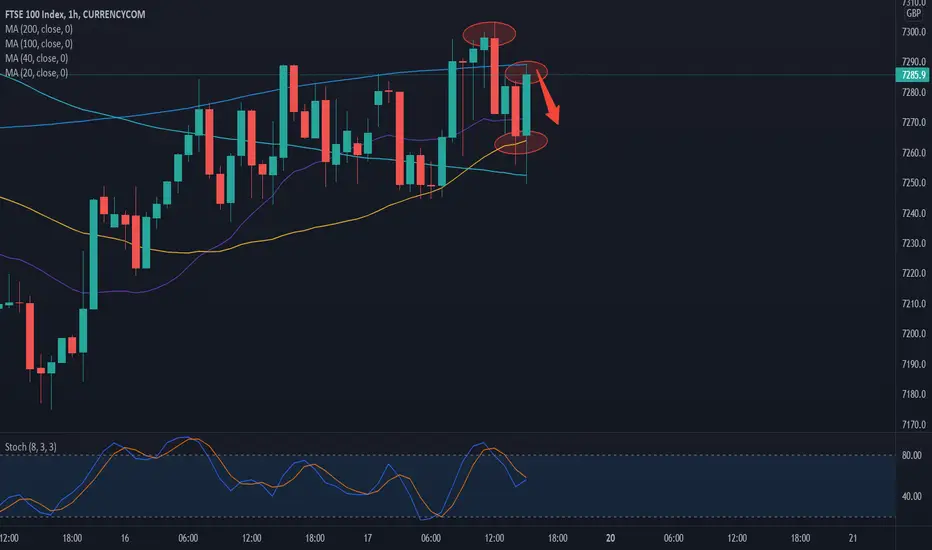
We can now look short as we approach our TECH short zones.
FTSE100 index . . . the laggard - Neutral to LONG
I may be a little foolhardy putting this chart up with CBs out in force this week, Omicron grabbing the headlines and the end of year fast approaching.
FTSE100 . . . the laggard index.
EMAs:
Black = 10
RED = 20
BLUE = 100
Fuchsia - 200
The GREEN and ORANGE are the daily 100 and 200 EMAs . . . always good to keep an eye on them.
MACD: A repetition of above with the 100/200/90 histogram showing.
Main Chart: Regression Chanel in RED from LOW to HIGH and then stretched to maximum Pearson's R. Second RC on the downward slope, stretched as before.
Horizontal BLUE box = SUPPORT
Horizontal BLACK arrow = NPOC . . . no, not a naked point of control but a Naked Previous OPEN/CLOSE that was just revisited yesterday. NPOCs are more relevant on currency pairs but that's another story.
FIB from L to H
Horizontal dotted RED and GREEN = daily range bands at 30 day average.
GREEN boxes = Previous STRONG Signals to trade. There are MEDIUM Signals there too but I've omitted because they need the accompanying charts to describe.
Good news = Price hit confluence of FIB at at 38, SUPPORT and NPOC and is bouncing up from downward RC
More Good news = 100 EMA is still above 200 EMA and just beginning to curve . . . this will be confirmed when the Histogram curves back up and turns GREEN.
Bad news = Price out of main RC . . . not all is lost so don't panic just yet !!
There are three scenarios to look out for:
1. A retest of the Low before a bounce.
2. No retest and a bounce . . . as I write it seems to prefer this scenario but it's testing both the 10 and 20 EMAs ATM so it could turn out to be option 1 if it rolls over . . . there's never just one option :)
3. Complete failure of the above and I start all over . . . it's all part of the job.
In either case (refer to previous GREEN boxes), it's only a BUY trade in this instance when the 10 EMA is above the 20 EMA and the 10EMA is above the 200 EMA . . . and I stress, PRICE will have broken out of the short RC to the upside (possibly/probably followed by a quick retest before resuming upward). Further visual confirmation will come from the MACD above zero and the histogram GREEN.
Targets are arbitrary to the individual . . . but if successful then PRICE has to surpass the previous high and aim for 7400 minimum. I can tell when to make a trade but it's entirely up to the individual when to close it.
I normally trade currencies and it's rare that I'll trade an index but this one has me interested, so I've been keeping an eye on it for the last month or two and have made a few successful trades on the way. I follow three charts of everything 60m/15m/5m with dual time frame analysis on all. PRIMARY/MAJOR/MINOR with 99% of analysis in the PRIMARY and MAJOR.
NB. I'm not trying to convince anyone of my methodology . . . each to their own but it works for me and if you have any questions just drop me a message as it's very difficult to explain everything in one chart and a few notes.
All the best TS

UK100GBPhello traders : the last two trades i took one ended full loss and the other BE and im now looking forward another opportunity,
UK100 the details clear in the chart,
how do you see this idea?

UK100 - Short Trade Idea - 7150 targetUK100, 15m Sell
Entry - 7192.8
Stop Loss - 1207.4 (14.4 pips)
Take Profit - 7152.8 (40 pips)

FTSE to riseFor more daily detailed analysis, don’t forget to click on the following button. Also, please ask any questions you may have and I will be happy to answer them.
We recently went short on the FTSE and targets were smashed yesterday.
Currently, COVID news sentiment and high inflation reports are moving this asset. In the very near term, the news will likely give us even more sentiment.
We are now looking to go long on the FTSE with an upside target.
We are at comfortable support with other technical aspects in our plan.
UK100 BREAKTHROUGH AND RETEST THE RESISTANCEThe FTSE 100 index is well placed to extend its recent run higher ahead of the Bank of England’s decision on UK interest rates next Thursday. Once seen as almost certain, a rate hike has become less likely because of the spread of the coronavirus Omicron variant.
That’s positive for UK stocks even though the Government has already responded by tightening the pandemic rules in England. Masks will now have to be worn in most indoor public places and employees have been told to work from home if they can.
The UK FTSE 100 index traded lower on Monday and touch and retest the broken resistance line from December 6th of the downtrend formed from drawn from the high of November 12th. That said, the slide was paused near the 7220.00 level, still above the prior downside resistance line. As long as the index is trading and stopped on that level and in combination with that the traders sentiment is net long, it would be interesting to see how the price will react in the following days.
In order to start examining whether the outlook has darkened further, the experts would like to see a clear dip below 7180.00, support marked by the inside swing, and 61.8Fibo correction. The price will already be below the aforementioned downside line and the bears may get encouraged to push the action towards. If they are not willing to stop there, then we could see them pushing towards the low around 7115.00 or lower to 38.2Fibo correction around 7050.00 or lower to the strong support and psychological level around 7000.00.
On the upside, the experts would like to see a clear rebound back from the current levels before start examining whether the bulls have gained full control again. This will take the index above the upside line and could aim for the 7370.00 or 7397.00 zones. Another break, above 7397, could see scope for extensions towards the peak of February 21st, 2020, at around 7460.
Looking at our oscillator indicators we have to notice that MACD and RSI are very close to the oversold zone but also noted big short volume bars at the end of the year.
Risk Disclosure: Trading Foreign Exchange (Forex) and Contracts of Difference (CFD's) carry a high-risk level. By registering and signing up, any client affirms their understanding of their own personal accountability for all transactions performed within their account and recognizes the risks associated with trading on such markets and such sites. Furthermore, one understands that the company carries zero influence over transactions, needs, and trading signals. Therefore, it cannot be held liable nor guarantee any profits or losses.

UK100 Descending Triangle Price closed below EMA 10, EMA 20, and Horizontal Support Resistance Level.

Uncertainty is precipitating selling. Volume is low. FTSE downAs expected the FTSE is trading lower within the ascending channel. I am looking for a further entry around the 4h200 ema. Omicron fears are the fundamental precipitant alongside the slow down for christmas.
I will be looking for a close below the 4h200 on this candle and will then await a retest of the MA or any MA on the 1 hour time frame below the white line. I expect this to occur within the next 24 hours and I will be looking to take profit around the 7050 area. Expect consolidation around 7010-7020 due to the major daily MAs coming in to play.
Trade Safe

FTSE crawling upDon't forget to Click on the follow button for more daily professional analysis. Also if you have any questions, please do ask them!
Here we have our updated FTSE 100 chart.
We are looking long on this bounce at higher TFS.
MA's are creating a good profit margin and we are UP trending.
Remember we want to trade with the current flow of the market at any time.
FTSE Another Leg Lower is Expected To Take PlaceShort-term Elliott wave view in FTSE suggests that the rally to 7404.31 high ended wave ((1)). Down from there, the index is doing a pullback in wave ((2)) to correct the cycle from the 10/28/2020 low before the upside resume. The internals of that pullback is unfolding as Elliott wave zigzag structure where initial decline to 7198.76 low ended wave 1. Then wave 2 ended at 7311.94 high, wave 3 ended at 7044.3 low. Wave 4 bounce ended at 7161.91 high and wave 5 ended at 6989.66 low thus ended the first leg in wave (A).
Up from there, the index made a short-term bounce in wave (B). The internals of that bounce also unfolded as a lesser degree zigzag structure where wave A ended at 7182.01 high. Wave B ended at 7083.21 low and wave C ended at 7378.92 high. Near-term, as far as bounces fail below 7378.92 high and more importantly below 7404.31 high the index is now expected to start the (C) leg lower. And expected to see more downside towards 6966.22- 6710.86 100%-161.8% Fibonacci extension area of (A)-(B). From there, the next leg higher is expected to take place or should produce a 3 wave bounce at least. Alternatively, if it breaks higher then the index might have done a running flat correction from the August peak.

UK 100 Slowly turning over..Don't forget to click on the follow button for more daily Professional analysis. Also if you have any questions, please do ask them!
Here we have our FTSE index.
We are still looking short as price returns to previous highs.
Price is now stalling on the current news sentiment and has room to fall.
We are shorting down to a comfortable area of support.
Targets and price movement is noted by directional arrows.

UK100 i expect price to touch down to the demand zone with a good retracement on fib at 70 or 79% to give us a good buy

FTSE pending planDon't forget to Click the follow button for more daily professional analysis. If you have any Questions, please do ask them!
Here is our FTSE chart,
Similarly to yesterday we are waiting for some sentiment to RE kick in.
We should see a fall back to more reasonable areas and comfortable support.
Target is labelled with our directional arrow.

UK100 SND ConceptsLike the USDOLLAR we apply the same Second Rule:
Rule 2: The price should reject from supply and fall to reach the first TP
.
Khiwe
On this profile page, the shared analysis, ideas, and also, the strategy of a chart belong to Khiwe with some being influenced. The technical set-ups are speculative, they are not guaranteed for accuracy or completeness in the form of any content; it is not to advise on financial markets. Please apply your own analysis and confirm it with price action.

$FTSE Can Rise One More Time To Fall - Important Key To MarketsTraders, FTSE (UK100) completed a huge bearish W pattern which gave us the level 7339. (See the attached idea). It missed the an important pre-covid level where we have a gap left. Last time it came very close and fell down for an initial reaction to create a bear trap. Now it will most probably try again to close that gap up and collect few stop losses around the FCP zone. This can be very good opportunity to short FTSE100 market for longer term.
US30 (Dow Jones), US500 (SNP500) and NASDAQ (NAS100) all have been closing their past gaps. US30 has few left close to all time high. As these gaps are closed on the high side, only bottoms ones will remain. FTSE is one of them. Having said that, do not take gap in to your trading strategy as gaps may take years and decades to fill.
Trade what you see and keep the risk management tight.
Rules:
1. Never trade too much
2. Never trade without a confirmation
3. Never rely on signals, do your own analysis and research too
✅ If you found this idea useful, hit the like button, subscribe and share it in other trading forums.
✅ Follow me for future ideas, trade set ups and the updates of this analysis
✅ Don't hesitate to share your ideas, comments, opinions and questions.
Take care and trade well
-Vik
____________________________________________________
📌 DISCLAIMER
The content on this analysis is subject to change at any time without notice, and is provided for the sole purpose of education only.
Not a financial advice or signal. Please make your own independent investment decisions.
____________________________________________________

UK 100 slowly slowly..Don't forget to click the follow button for more daily professional analysis,
Here we have our little unchanged UK 100 chart.
The current rally and market sentiment has driven this asset back to recent highs.
Price is way too high now and at sell zones we formerly discussed.
We are now looking short back down to former Support and our Key MA's.

Short Opportunity on UK100 According to FIBO Retracement
Divergence between the CCI with Price Move on Chart
Price Action / Minor Trendline Broken , now Re tested


FTSE 100 Short Idea Today at 5:30 the UK PM will be announcing a "Plan B" covid plan for the coming weeks after the emergence of the new Omnicron variant. Depending on the plan it's possible for Sterling and UK stocks to plummet if the news is bearish. The RSI indicators on the 4hr chart have just started to edge down from its overbought regions (85) indicating that there is room to go down. If we look to Europe and the economic impact that covid has had it's likely for the same to happen to the FTSE100.
