GbpcadGood day,
There is a very good compress toward our sell zone with lq.
Limit sell 1.7177
Stop loss :1.7190
Target : 80 pip
Good luck
GBPCAD trade ideas

Long Opportunity on GBPCADGBPCAD has broken the structure to upside and coming back to clear out liquidity. I have identified an Unmitigated OB from where I think market will move upward.

GBPCAD LONGMarket Structure is Bullish on Higher Time Frames
Weekly Rejection at AOI
Strong Daily Rejection at AOI
Weekly and Daily around same AOI
Around Psychological Level 1.70500
H4 Double Bottom
REMEMBER: Trading is a Game Of Probability
: Manage Your Risk
: Be Patient
: Every Moment Is Unique
: Rinse, Wash, Repeat!
: Stay Hydrated

GBPCAD- Quick rebound Overall trend is still very bullish, we will enter a short term rebound....
Good luck

GBPCAD LONG IDEAGood Day everyone, here is an idea for a Long opportunity! Price Has reach EMA and we will expect it will continue to going up.
Long now for a good 1 to 2 RR.
so far we are up for 8R(Jan)

GBP CADGBP CAD sell idea
M formation, trend break
broken trend line
trendline test
I assume after news on CAD, sell GBP CAD
entry around 1.70700

GBPCAD sell setupFX:GBPCAD
The weekly, 4h and 1h timeframes are bearish giving me a bearish bias. Price broke below 1.70666 4h/1h support area simultaneously breaking bullish structure of the 1h and 4h. I am waiting on a pullback to the 1.70666 area which will now be the resistance area to look for sells on gbpcad

GBPCAD 4hr - waiting for price to drop to 1.70561 to go long4hr Trend, strong uptrend
RSI(7) - just dipping through the 50 level
Looking for bullish confirmation at 1.70561 to go long
CAD CPI being released, negative inflation data can weaken the CAD

DeGRAM | GBPCAD false break of the psychological levelGBPCAD is trading in the ascending channel. It created divergence at the resistance level.
The market rebounded from the psychological level at 1.71000 and closed below it.
Price decelerated while approaching resistance, so most likely it will go down.
-------------------
Share your opinion in the comments and support the idea with like. Thanks for your support!

GBPCAD - ShortLooking for short positions, it is a clearly divergence (RSI), as well as if we take now the position it has a good Risk Reward Ratio > 1.5

GBPCAD: TECHNICAL ANALYSIS.Hello traders,
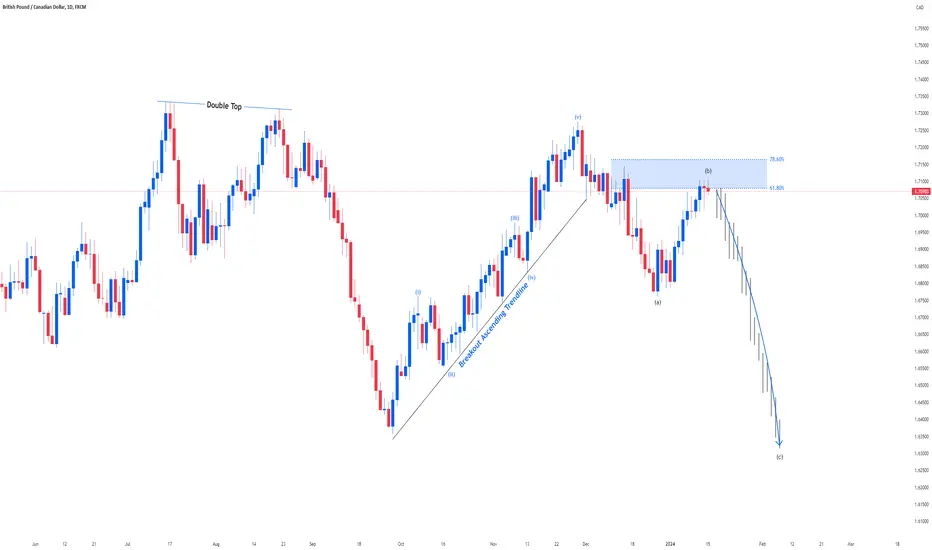
Wave 5 is supposed to end at 1.71266-1.71580 zone. Then ABC Correction is supposed to materialise towards the support zone at 1.69870.
Thanks.

Gbpcad bullish structureGbpcad H4 above 1.71057
Making it a new high in the market
The structure is very much bullish so am
Expecting a Retracement to that level and then we can target highs above

GBPCAD - Bullish Double Bottom 📈Hello Traders !
On Wednesday 27 Dec, The GBPCAD Reached a Support Level (1.67077 - 1.67633).
The Price Formed a Double Bottom Pattern.
Currently,
-The Neckline is Broken.
So, I Expect a Bullish Move 📈.
-----------
TARGET: 1.71100🎯

GBPCAD 15/01Pair : GBPCAD ( British Pound / Canada Dollar )
Description :
Completed " 12345 " Impulsive Waves and " ABC " Corrective Waves and making its Impulsive Waves. Bullish Channel as an Corrective Pattern in Short Time Frame wait for Rejection or Breakout. Strong Divergence in RSI


Buy GBPCAD Triangle PatternFactors Strengthening GBP:
Hawkish BoE: Recent hawkish comments from Bank of England (BoE) officials regarding potential interest rate hikes to combat inflation have bolstered the Pound. This has increased its attractiveness compared to the Canadian Dollar.
Optimism on UK economy: Despite ongoing Brexit negotiations, positive economic data releases like higher-than-expected GDP growth and retail sales figures paint a picture of a resilient UK economy. This fuels investor confidence in the Pound.
Price breaks the Pattern now, its good chance to buy now.
Thank you.

GBPCAD This is a special analysis using the SK system, and this is shown in the drawing. After achieving the purchasing goals in this green box, we wait for the drop down to the health correction areas (WCL).

GBPCAD - Dow Theory - Trendlines- Bullish Trend
- Dow theory (HH's , HL's)
- Ascending Trendline
- No Divergence
- Buy Stop Executed for confirmation of higher high
TC - 2

GBPCAD Sell Trade Idea , GBPCAD Short trade idea. GBPCAD Sell Trade Idea
The major resistance point of 1.71000 has already been tested by the market, and we will now see clear changes in case we find some price rejections over their major point of 1.7100-1.7123.
Trade Setup Idea:
GBPCAD Selling Zone: 1.7100-1.7123
Stop Loss: 1.71311
Take Profit1: 1.7068
Take Profit2: 1.7050
Take Profit3: 1.7020
Take Profit4: 1.6990
Note: Please follow the money management plan and risk-reward ratio.
Must follow the price rejections and price movements of the pound index.

GBPCAD Bounces Back from Crucial Resistance PointThe market is currently assessing the critical resistance at 1.71000 following a breakout from the channel. Notably, the price has successfully breached both resistance and range zones. Anticipating a test of the support level, and potentially the lower border of the descending channel.
A probable scenario involves a descent from the resistance zone due to a lack of bullish momentum, coupled with a prior descent. Additionally, a divergence at this level indicates an impending pullback.
🎯 Targeting the support level at 1.69750.

GBPCAD:TECHNICAL ANALYSIS.Hello traders,
Wave 4 is supposed to end at 1.71024-1.71463 zone. Then wave 5 is supposed to materialise
towards the support zone at 1.67050.
Thanks.

GBPCADOn the monthly charts we have a bearish trend targeting the monthly low.
On the weekly charts we have a bullish correction that has cleared a previous ineffeciency.
On the daily we have a change of character indicating a trends reversal. However, on the lower timeframe we have a bullish correction.
On the 4 hour we are awaiting a change of character to signify a bearish continuation
