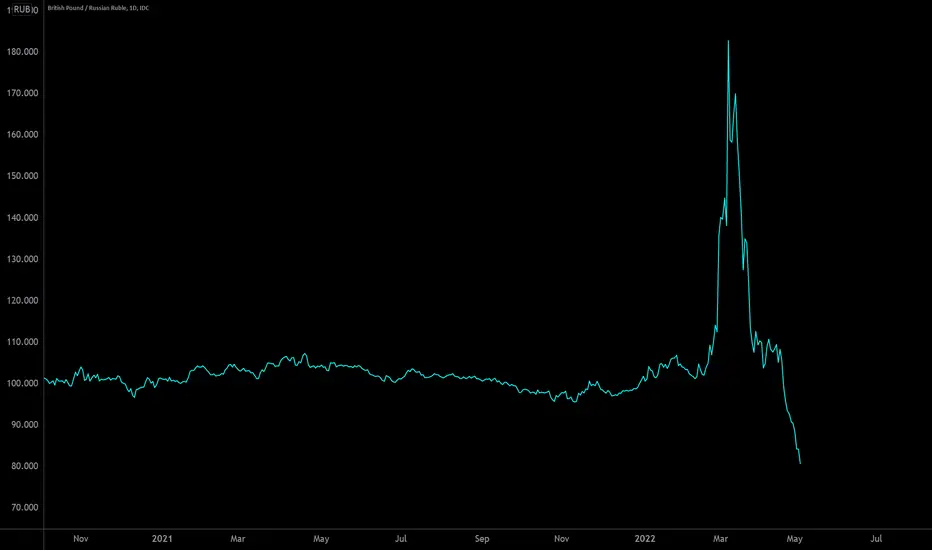
Who is winning?Or better: Who is really getting punished by the sanctions imposed on Russia? If there is a more dramatic picture about the self-destructive effect the measures have, let me know.


RidetheMacro| GBPRUB More Upside Growth !Trade Analysis Based on Fundamentals and Price Action.
With Risk Management you Will Never loss.
All Comments and Ideas will Appreciated.
Thank You

RidetheMacro| GBPRUB Russia on Track Again!A "no-deal" Brexit could be three times more costly to Britain's economy in the long term than the coronavirus outbreak, a new study published Tuesday warned.the political and economic effects of the pandemic were likely to mitigate or hide that of failing to secure a trade agreement with the EU.
📌


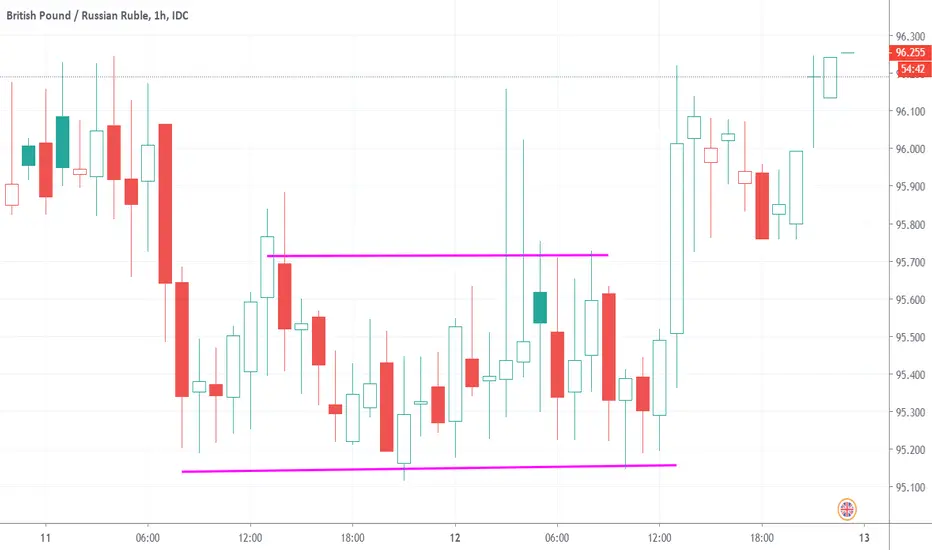
GBPRUB, Rectangle Bottom (bullish)STATUS = Confirmed
CURRENT CONFIDENCE = 5%
TARGET (EXIT) PRICE = 96.239253 RUB
BREAKOUT (ENTRY) PRICE = 95.780055 RUB
DISTANCE TO TARGET PRICE = 0.02% (2.2 pips)
EMERGED ON Aug 12, 06:00 AM (UTC)
CONFIRMED ON Aug 12, 01:14 PM (UTC)
WITH CONFIDENCE LEVEL = 73%
I found this pattern at tickeron websi
GBPRUB, Triple Bottoms (bullish)STATUS = Confirmed
CURRENT CONFIDENCE = 63%
TARGET (EXIT) PRICE = 90.449193 RUB
BREAKOUT (ENTRY) PRICE = 90.079150 RUB
DISTANCE TO TARGET PRICE = 0.18% (16.0 pips)
EMERGED ON Jul 17, 12:00 PM (UTC)
CONFIRMED ON Jul 17, 02:51 PM (UTC)
WITH CONFIDENCE LEVEL = 70%
Tickeron AI shows that the Triple Bot

GBPRUB's in Uptrend: MACD Histogram crosses above signal lineThis is a Bullish indicator signaling GBPRUB's price could rise. Traders may explore going long on the ticker or buying call options. Tickeron AI shows that
in 58 of 83 cases where GBPRUB's MACD histogram became positive, the price rose further within the following month. The odds of a continued Upt

See all ideas
Displays a symbol's price movements over previous years to identify recurring trends.