21/5 GBPUSD trading plan.
GBPUSD bought near 1.27000. Relying on the room for the dollar to fall FX:GBPUSD OANDA:GBPUSD FOREXCOM:GBPUSD
GBPUSD trade ideas

GBPUSD - Sells - 1:2RRLooking to take some sells on GU
1 hour failed to close above resistance (at top) twice then came down and closed below the 4 hour resistance.
Entry 1.27108
SL 1.27191
BE point 1.27076
TP 1.26944

✅GBP_USD BULLISH SETUP|LONG🚀
✅GBP_USD broke the falling
Resistance and the breakout
Is confirmed so I am bullish
Biased and I will be expecting
A further move up
LONG🚀
✅Like and subscribe to never miss a new idea!✅

GBPUSD is approaching the uptrendHey Traders, in today's trading session we are monitoring GBPUSD for a buying opportunity around 1.26700 zone, GBPUSD is trading in an uptrend and currently is in a correction phase in which it is approaching the trend at 1.26700 support and resistance area.
Trade safe, Joe.
Let me know what do you think about inflation progress in the comment section

GBPUSD Strong sell approaching but know when to take it.The GBPUSD pair is approaching the top (Lower Highs trend-line) of the long-term Triangle pattern, having also broken at the same time above the 0.618 Fibonacci. This is around the levels the pair started its previous topping process that led to the eventually Lower High of March 08 2024.
We will take the sell when the 1D MACD forms a Bearish Cross and we will target the Triangle's bottom (Higher Lows trend-line) at 1.2400.
-------------------------------------------------------------------------------
** Please LIKE 👍, FOLLOW ✅, SHARE 🙌 and COMMENT ✍ if you enjoy this idea! Also share your ideas and charts in the comments section below! This is best way to keep it relevant, support us, keep the content here free and allow the idea to reach as many people as possible. **
-------------------------------------------------------------------------------
💸💸💸💸💸💸
👇 👇 👇 👇 👇 👇

GBPUSD Reversal GBPUSD has formed a double top and a 4h Bearish Divergence.
Also sentiments are 84 Short.
Sell Stops can be at placed 1.26419 the break of LH.

GBPUSD - SELL
Initial Signal BUY
But now Rteurn to Previous Level
Core Inflation Rate YoY (Apr) MEDIUM Previous 0.042 Consensus 0.036 Actual 0.039 Signal BUY
CCPV Rolling over on 1 m
Over Extended
Pulled Bac into FVG
Crossed Trigger Line
USD Stronger on CPM
London Open 10 mins ago Pushing Down
Sellers have Turned Red
In this game u have to Anticipate
: )

GBPUSD is on SHORTThe price has reached to high high point H1 and its gonna be Short to create another HL

GBPUSD - Wait for the Bears 📉Hello TradingView Family / Fellow Traders. This is Richard, also known as theSignalyst.
📈 GBPUSD has been overall bullish, trading within the rising channel in blue.
At present, GBPUSD is approaching the upper bound of the channel acting as an over-bought zone.
Moreover, it is retesting a strong supply zone.
🏹 Thus, the highlighted red circle is a strong area to look for sell setups as it is the intersection of the green supply and upper blue trendline.
📚 As per my trading style:
As #GBPUSD is hovering around the circle zone, I will be looking for bearish reversal setups (like a double top pattern, trendline break , and so on...)
📚 Always follow your trading plan regarding entry, risk management, and trade management.
Good luck!
All Strategies Are Good; If Managed Properly!
~Rich

Bullish bounce off 38.2% Fibonacci support?The Cable (GBP/USD) is falling towards the pivot and could potentially bounce to the 1st resistance.
Pivot: 1.2634
1st Support: 1.2567
1st Resistance: 1.2763
Risk Warning:
Trading Forex and CFDs carries a high level of risk to your capital and you should only trade with money you can afford to lose. Trading Forex and CFDs may not be suitable for all investors, so please ensure that you fully understand the risks involved and seek independent advice if necessary.
Disclaimer:
The above opinions given constitute general market commentary, and do not constitute the opinion or advice of IC Markets or any form of personal or investment advice.
Any opinions, news, research, analyses, prices, other information, or links to third-party sites contained on this website are provided on an "as-is" basis, are intended only to be informative, is not an advice nor a recommendation, nor research, or a record of our trading prices, or an offer of, or solicitation for a transaction in any financial instrument and thus should not be treated as such. The information provided does not involve any specific investment objectives, financial situation and needs of any specific person who may receive it. Please be aware, that past performance is not a reliable indicator of future performance and/or results. Past Performance or Forward-looking scenarios based upon the reasonable beliefs of the third-party provider are not a guarantee of future performance. Actual results may differ materially from those anticipated in forward-looking or past performance statements. IC Markets makes no representation or warranty and assumes no liability as to the accuracy or completeness of the information provided, nor any loss arising from any investment based on a recommendation, forecast or any information supplied by any third-party.

GBPUSD ANALYSIS BUY OPPORTUNITY Daily updates free analysis best trade for gold btc gbp all currency
Never miss best annals

✅GBP_USD BULLISH BREAKOUT|LONG🚀
✅GBP_USD is going up currently
And the pair broke the key structure level of 1.270
Which is now a support, and after the pullback
And the retest, I think the price will go up
LONG🚀
✅Like and subscribe to never miss a new idea!✅

GBPUSD. Weekly trading levels 20 - 24.05.2024During the week you can trade from these price levels. Finding the entry point into a transaction and its support is up to you, depending on your trading style and the development of the situation. Zones show preferred price ranges WHERE to look for an entry point into a trade.
If you expect any medium-term price movements, then most likely they will start from one of the zones.
Levels are valid for a week, the date is in the title. Next week I will adjust the levels based on new data and publish a new post.
! Please note that brokers have a difference in quotes, take this into account when trading.
The history of level development can be seen in my previous posts. They cannot be edited or deleted. Everything is fair. :)
----------------------------------------------
I don’t play guess the direction (that’s why there are no directional arrows), but zones (levels) are used for trading. We wait for the zone to approach, watch the reaction, and enter the trade.
Levels are drawn based on volumes and data from the CME. They are used as areas of interest for trading. Traded as classic support/resistance levels. We see the reaction to the rebound, we trade the rebound. We see a breakout and continue to trade on a rollback to the level. The worst option is if we revolve around the zone in a flat.
Do not reverse the market at every level; if there is a trend movement, consider it as an opportunity to continue the movement. Until the price has drawn a reversal pattern.
Don't forget to like Rocket and Subscribe!!! Feedback is very important to me!

GBP/USD Reaches Strongest Level Since March Amid Bullish Moment.The GBP/USD pair gained bullish momentum, reaching its highest level since March 21, surpassing 1.2750 during the early European session on Wednesday. In this area, we have identified confluences between the premium area of supply and resistances, along with a divergence on the RSI indicating overbought conditions.
Today, data published by the UK's Office for National Statistics (ONS) showed that inflation in the UK, as measured by the Consumer Price Index (CPI), declined to 2.3% year-on-year in April from 3.2% in March. However, this reading was above the market expectation of 2.1%. The core CPI, which excludes volatile food and energy prices, increased by 3.9% during the same period, exceeding analysts' estimates of 3.6%.
Despite this economic data, the price appears to have made a bullish spike in lower timeframes, with a new H4 candle opening with a bearish sentiment. The price may reject the aforementioned area and retrace 50% from the major swing higher.

GBP/USD SELLERS WILL DOMINATE THE MARKET|SHORT
Hello,Friends!
The BB upper band is nearby so GBP-USD is in the overbought territory. Thus, despite the uptrend on the 1W timeframe I think that we will see a bearish reaction from the resistance line above and a move down towards the target at around 1.254.
✅LIKE AND COMMENT MY IDEAS✅

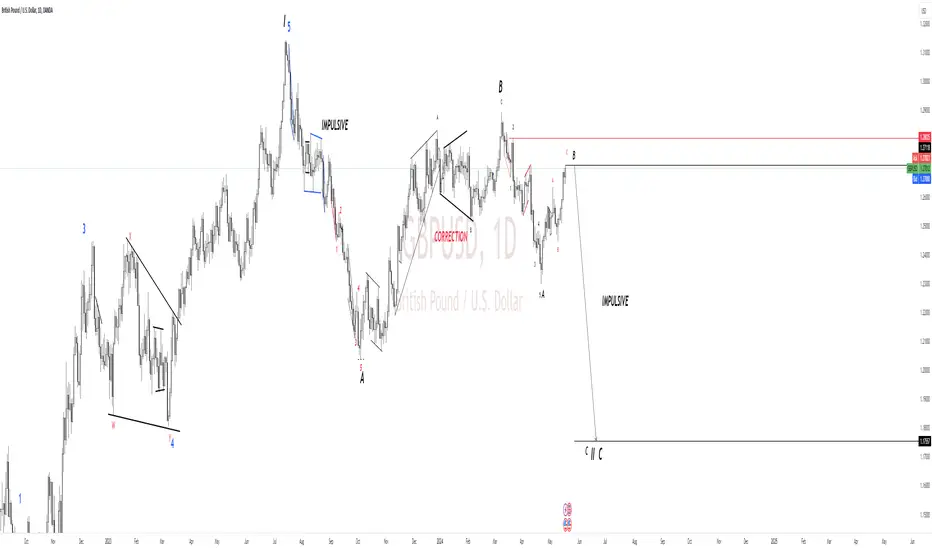
GBPUSD BEARISH FOR COMING MONTHAs i mentioned earlier, I was focus for bearish side. My plan stick to bearish movement and not for bullish side. I only entering the market if price can make and impulsive move to downside for next couple of days. This is my trade idea and would appreciate if you guys can comment share your idea too. Tq
GBPUSD Trading Insights: Capitalizing on Bearish Opportunities!Dear Traders,
On Friday, the GBPUSD experienced significant volatility, leading to a notable upward movement. This action resulted in the formation of a Low Resistance Liquidity Zone, indicating minimal resistance for price movement through this area. Additionally, the price left relatively equal lows, suggesting the presence of H4 Sell Stops. We anticipate the price to target this area, which aligns with the Daily Fair Value Gap (FVG), drawing liquidity in that direction.
Currently, we are considering two scenarios for potential confirmation entries towards our objectives:
H1 Bearish Order Block : We are at an H1 bearish order block, and a price sell-off from this point is possible if we receive the appropriate confirmation signals.
H1 Buy Stops : Alternatively, the price may trigger the H1 Buy Stops. In this scenario, we expect smart money to take positions against these buy stops, creating selling opportunities. Confirmation entries will be considered if this occurs.
Please stay tuned for our upcoming weekly video outlook on GBPUSD, where we will provide further insights and detailed analysis.
Best regards,
Kind Regards,
The_Architect

GBPUSD accelerated to the upside this past weekGBPUSD accelerated to the upside this past week, briefly reaching its highest level in nearly two months at one point before the weekend. If the rally continues and gains momentum in the coming sessions, resistance is likely to appear at 1.2720, the 61.8% Fibonacci retracement of the 2023 decline. Further strength could then direct focus toward the 1.2800 mark.
On the flip side, if the upward impetus fades and sellers regain control of the market, confluence support extending from 1.2615 to 1.2585 could offer stability in case of a pullback. If tested, traders should watch closely for price reaction, keeping in mind that a breakdown could give way to a move towards the 200-day simple moving average hovering around 1.2540.

Potential bullish rise?GBP/USD has just broken out of a resistance level which is a pullback resistance and could rise from this level to our take profit.
Entry: 1.2698
Why we like it:
There is a pullback resistance level.
Stop loss: 1.2635
Why we like it:
There is a pullback support level which lines up with the 38.2% Fibonacci retracement.
Take profit: 1.2797
Why we like it:
There is a pullback resistance level which lines up with the 61.8% Fibonacci projection.
Please be advised that the information presented on TradingView is provided to Vantage (‘Vantage Global Limited’, ‘we’) by a third-party provider (‘Everest Fortune Group’). Please be reminded that you are solely responsible for the trading decisions on your account. There is a very high degree of risk involved in trading. Any information and/or content is intended entirely for research, educational and informational purposes only and does not constitute investment or consultation advice or investment strategy. The information is not tailored to the investment needs of any specific person and therefore does not involve a consideration of any of the investment objectives, financial situation or needs of any viewer that may receive it. Kindly also note that past performance is not a reliable indicator of future results. Actual results may differ materially from those anticipated in forward-looking or past performance statements. We assume no liability as to the accuracy or completeness of any of the information and/or content provided herein and the Company cannot be held responsible for any omission, mistake nor for any loss or damage including without limitation to any loss of profit which may arise from reliance on any information supplied by Everest Fortune Group.

CHART BREAKDOWN GBPUSD: Key Levels, Targets and Thoughts!🎯Brief Description🖊️:
The chart provides insights into critical market levels, emphasizing an essential demand zone (low-risk buy zone) spanning from 1.25450 to 1.25350. Additionally, medium-risk buy zone between 1.26000-1.25900, respectively, are highlighted.
Things I Have Seen👀:
Important Demand Zone🟢: Identified between 1.25450 and 1.25350, serving as a low-risk buy.
Medium-Risk Buy Zone🟠: Noted between 1.26000 and 1.25900, suggesting another area with moderate risk for potential buying positions.
Bullish Targets📈:
1.25500: Possible retracement area.
1.25900: Possible retracement area.
1.26200: Possible retracement area.
1.26750: Significant supply zone.
1.27000: Liquidity area.
What's Important Now❗
Currently, the crucial approach is to wait and observe the price action at this level. We need to assess how the market reacts before considering any decisive moves. Stay observant and responsive to real-time developments in the market.

BEARISH SIGNAL ON GBPUSDbuyers are finding it hard to push the price higher to create a new high so price has created 3 consecutive higher lows leading price to form its first lower high. with a bearish retest to the 0.66 and 0.618 fib level price can see a good entry level to the down side

GBPUSD Down Trend Level "In the four-hour chart, we see a very strong trend that can halt the pound's rise against the dollar. We must be cautious of the dollar index at the entry point in order to succeed in the trade."

GBP/USD Shorts from 1.27500 back downMy bias this week is to look for nearby sell opportunities as we approach a strong supply zone on the 21-hour chart. I will wait for a Wyckoff distribution to unfold, likely on Monday or Tuesday, to take sells back down to the next demand zone.
Since the equal highs have been swept, I expect the price to slow down and provide a clear entry model for shorts. Despite the current bullish trend, I plan to take these sells down to the next demand zone, where I will look for long positions to continue the trend.
Confluences for GU Sells are as follows:
- 21hr supply zone has caused a break of structure to the downside and has an imbalance
- The overall trend on the higher time frame is bearish and the dollar is also overall bullish.
- Price has swept equal high liquidity enough to now break back down.
- Bullish pressure is getting exhausted after the bullish rallies we saw last week.
P.S. Since the price hasn't yet tapped into the supply zone, I'm also watching for an Asian high sweep, which will further confirm my sell bias. Additionally, we're approaching the psychological level of 1.27500, so it will be interesting to see how the price reacts.
Have a great trading week!
