
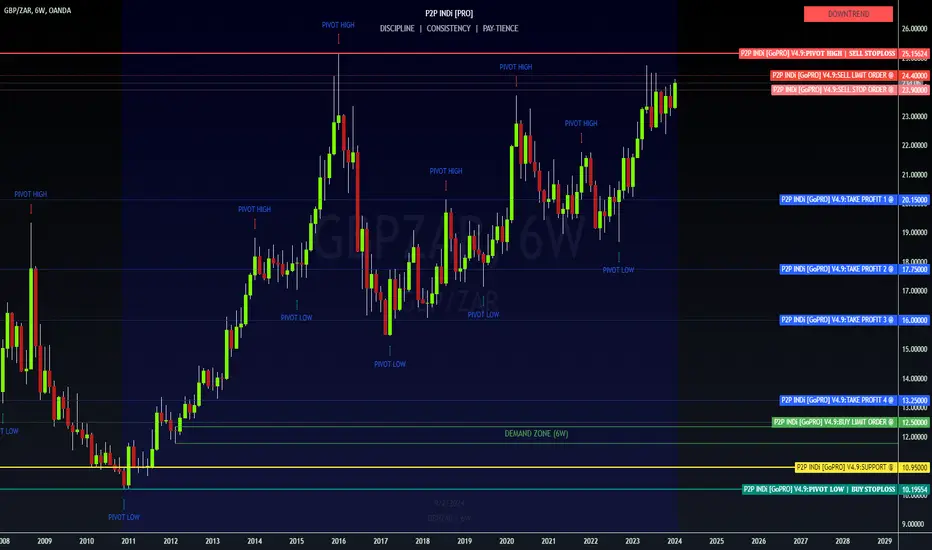
A high reward GBP/ZAR selling opportunityThe markert has completed a running flat correction and therefore wave C is expected. the pound is very bearish and will be for months to come.

🔥 GBPZAR: Curve Analysis (6W) 🔥SLO2 @ 24.40 ⏳
SLO1 @ 23.90 ⏳
TP1 @ 20.15
TP2 @ 17.75
TP3 @ 16.00
TP4 @ 13.25
BLO @ 12.50 ⏳
ADDITIONAL INFO:
🤔 If this HTF Curve Analysis holds on this 3H chart, then we'll have an opportunity to short
🏆 POSITION TRADERS: +45.70% or 111,500 pip OPPORTUNITY (max)‼️
✍️ NOTE: Each TP is a POC where
GBPZARHigh changes for downtrend because 4 hour and 1 hour both trend is down. Caution GBP news may change direction or liquidity grab.

GBPZAR short setup.This pair has just completed an ending diagonal reversal pattern , complemented by divergence. Looking to short it and targeting R22/Pound.

GBPZAR November 19th, 2023The Chicago Mercantile Exchange's Commitments of Traders (COT) report for the week ending November 14, 2023, shows that there are signs of weakness for the British pound (GBP).
Non-commercial traders, which are typically hedge funds and other large institutional investors, reduced their long positi

GBP-ZAR - Keylevels - DailyThese are the keylevels on daily for GBP-ZAR, there is still in a bearish trend , and if you want a confirmation, just move on weekly.

gbpzar looking bearish seems like getting ready for downside breakout
formed ascending channel in daily timeframe and expecting downside breakout incase of successful breakout expecting bearish wave towards 21
keep eyes on for breakout

Bullish FlagAs the bullish flag suggest that the the bullish trend will continue al it does not hv any divergence

GBPZAR bullish idea (scenario-1)GBPZAR cup & handle pattern found as per 1H, it's already tp-1 achieved, still we can enter after break higher high up to TP-2 as marked. It's scenario-1, I will analyses bigger time frame 4H, 4h telling another story.

See all ideas
Trade directly on the supercharts through our supported, fully-verified and user-reviewed brokers.


Frequently Asked Questions
Currencies are usually traded through forex brokers — choose the one that suits your needs and go ahead. You can trade GBPZAR right from TradingView charts — just log in to you broker account. Check out the list of our integrated brokers and find the best one for your needs and strategy.
The value of the GBPZAR pair is quoted as 1 GBP per x ZAR. For example, if the pair is trading at 1.50, it means it takes 1.5 ZAR to buy 1 GBP.