Next report date
Report period
Q2 2024
EPS estimate
1.11EUR
Revenue estimate
1.47 BEUR
3.89EUR
1.17 BEUR
6.46 BEUR
291.84 M
About Agilent Technologies, Inc.
Sector
Industry
Headquarters
Santa Clara
Website
Employees (FY)
18.1 K
Founded
1999
Agilent Technologies, Inc. engages in the provision of application focused solutions for life sciences, diagnostics, and applied chemical markets. It operates through the following segments: Life Sciences and Applied Markets, Diagnostics and Genomics, and Agilent CrossLab. The Life Sciences and Applied Markets segment offers application-focused solutions that include instruments and software that identify, quantify, and analyze the physical and biological properties of substances and products, as well as the clinical and life sciences research areas to interrogate samples at the molecular and cellular level. The Diagnostics and Genomics segment consists of activity providing active pharmaceutical ingredients for oligo-based therapeutics, as well as solutions that include reagents, instruments, software and consumables. The Agilent CrossLab segment includes startup, operational, training and compliance support, software as a service, and asset management and consultative services. The company was founded in May 1999 and is headquartered in Santa Clara, CA.

A - fall -11.59% to $1.22 per share on February 27The last earnings report on October 31 showed earnings per share of $1.38, beating the estimate of $1.35. P/B Ratio (6.618) is normal, around the industry mean (25.768). P/E Ratio (31.511) is within average values for comparable stocks, (78.874). Projected Growth (PEG Ratio) (2.536) is also within n

Long-term position in Agilent Technologies, Inc $AThis week, I entered into a long-term position in Agilent Technologies, Inc NYSE:A
Timeframe: M
SL: ~$107
Target: $216

Agilent small bull runAgilent has just defined a HL and is now moving towards the next resistance level
This is a simple jump and jump out trade
Entry @ 131-132
Stop loss @ 122
TP @ 140
if it breaks above 140 then as you wish TP

AUDCAD LONG AND SHORT TERM ANALYSIS 1/7/24(Audcad long- and short-term analysis)
I wanted to show you guys my whole thought process through Audcad so you guys can watch how this plays out.
* as traders we cannot predict the market but we can take what its giving us and run with it.

NYSE-A - a good time to buy! (indicator Thewaved)The last signal to buy on this strategy was given September 15.
The price of the asset at the time of entry into the trade was 113.79.
Our goals for this trade are as follows.
Take-Profit is set at 227.6.
and Stop-Loss Order at 96.7 At the moment, the price is moving well in the signal direction

A Agilent Technologies Options Ahead of EarningsAnalyzing the options chain and the chart patterns of A Agilent Technologies prior to the earnings report this week,
I would consider purchasing the 125usd strike price Puts with
an expiration date of 2023-9-15,
for a premium of approximately $3.45.
If these options prove to be profitable prior to t

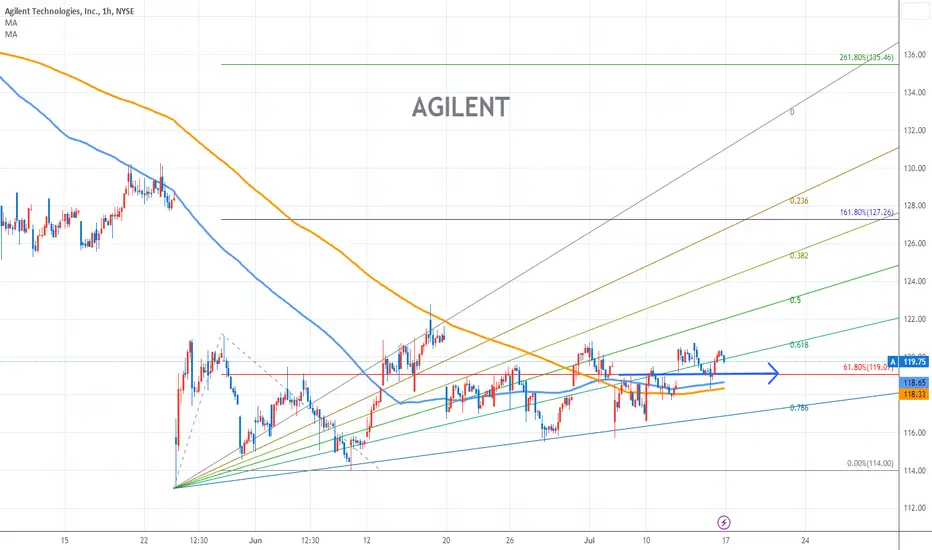
AGILENT Stock Chart Fibonacci Analysis 071623 Trading Idea
1) Find a FIBO slingshot
2) Check FIBO 61.80% level
3) Entry Point > 119/61.80%
Chart time frame : B
A) 15 min(1W-3M)
B) 1 hr(3M-6M)
C) 4 hr(6M-1year)
D) 1 day(1-3years)
Stock progress : A
A) Keep rising over 61.80% resistance
B) 61.80% resistance
C) Hit the bottom
D) Hit the top
AGILENT TECHNOLOGIES still bearish for expect
Hi viewers, A strong bearish in alst periods, currently price on zone, tech. side showing we can expect still bearish trend
TP1:130
TP2:126

RectangleNeutral until broken.
Price is balancing on the support line.
Earnings 2-28 AMC.
SHORT is around 1%

See all ideas
Trade directly on the supercharts through our supported, fully-verified and user-reviewed brokers.


Frequently Asked Questions
The current price of AG8 is 128.96 EUR — it has increased by 1.34% in the past 24 hours.
Depending on the exchange, the stock ticker may vary. For instance, on GETTEX exchange AGILENT TECHNOLOGIES INC stocks are traded under the ticker AG8.
AGILENT TECHNOLOGIES INC is going to release the next earnings report on May 21, 2024. Keep track of upcoming events with our Earnings Calendar.
AG8 stock is 1.34% volatile and has beta coefficient of 1.29. Check out the list of the most volatile stocks — is AGILENT TECHNOLOGIES INC there?
AG8 earnings for the last quarter are 1.31 EUR per share, whereas the estimation was 1.27 EUR resulting in a 2.80% surprise. The estimated earnings for the next quarter are 1.13 EUR per share. See more details about AGILENT TECHNOLOGIES INC earnings.
AGILENT TECHNOLOGIES INC revenue for the last quarter amounts to 1.60 B EUR despite the estimated figure of 1.58 B EUR. In the next quarter revenue is expected to reach 1.47 B EUR.
Yes, you can track AGILENT TECHNOLOGIES INC financials in yearly and quarterly reports right on TradingView.
AG8 stock has risen by 3.85% compared to the previous week, the month change is a 3.51% fall, over the last year AGILENT TECHNOLOGIES INC has showed a 6.49% increase.
AG8 net income for the last quarter is 321.72 M EUR, while the quarter before that showed 449.26 M EUR of net income which accounts for −28.39% change. Track more AGILENT TECHNOLOGIES INC financial stats to get the full picture.
Today AGILENT TECHNOLOGIES INC has the market capitalization of 37.63 B, it has decreased by 2.42% over the last week.
Yes, AG8 dividends are paid quarterly. The last dividend per share was 0.22 EUR. As of today, Dividend Yield (TTM)% is 0.66%. Tracking AGILENT TECHNOLOGIES INC dividends might help you take more informed decisions.
AGILENT TECHNOLOGIES INC dividend yield was 0.87% in 2023, and payout ratio reached 21.48%. The year before the numbers were 0.61% and 20.10% correspondingly. See high-dividend stocks and find more opportunities for your portfolio.
Like other stocks, AG8 shares are traded on stock exchanges, e.g. Nasdaq, Nyse, Euronext, and the easiest way to buy them is through an online stock broker. To do this, you need to open an account and follow a broker's procedures, then start trading. You can trade AGILENT TECHNOLOGIES INC stock right from TradingView charts — choose your broker and connect to your account.
As of Apr 28, 2024, the company has 18.10 K employees. See our rating of the largest employees — is AGILENT TECHNOLOGIES INC on this list?
Investing in stocks requires a comprehensive research: you should carefully study all the available data, e.g. company's financials, related news, and its technical analysis. So AGILENT TECHNOLOGIES INC technincal analysis shows the neutral today, and its 1 week rating is buy. Since market conditions are prone to changes, it's worth looking a bit further into the future — according to the 1 month rating AGILENT TECHNOLOGIES INC stock shows the buy signal. See more of AGILENT TECHNOLOGIES INC technicals for a more comprehensive analysis.
If you're still not sure, try looking for inspiration in our curated watchlists.
If you're still not sure, try looking for inspiration in our curated watchlists.
We've gathered analysts' opinions on AGILENT TECHNOLOGIES INC future price: according to them, AG8 price has a max estimate of 154.89 EUR and a min estimate of 122.04 EUR. Read a more detailed AGILENT TECHNOLOGIES INC forecast: see what analysts think of AGILENT TECHNOLOGIES INC and suggest that you do with its stocks.
EBITDA measures a company's operating performance, its growth signifies an improvement in the efficiency of a company. AGILENT TECHNOLOGIES INC EBITDA is 1.73 B EUR, and current EBITDA margin is 27.79%. See more stats in AGILENT TECHNOLOGIES INC financial statements.