5 years for Sage to break out?It's taken 5 years for Sage to break out from 824 resistance. Good results today have seen the price initially increase by about 4%. Let's see if this is a true break or a bull trap as it was in Dec 2021.
Looks bullish to me but do your own research and this is not a recommendation to trade.
Next report date
—
Report period
—
EPS estimate
—
Revenue estimate
—
0.31EUR
243.46 MEUR
2.52 BEUR
992.07 M
About SAGE GROUP GBP0.01051948
Sector
Industry
CEO
Steve Hare
Website
Headquarters
Newcastle-upon-Tyne
Employees (FY)
11.33 K
Founded
1988
ISIN
GB00B8C3BL03
The Sage Group plc engages in the provision of business management solutions. It offers accounting, enterprise resource planning and payroll software. It operates through the following geographical segments: North America, UK and Ireland, Europe, and Africa and APAC. The company was founded by David Goldman, Paul Muller, and Graham Wylie in 1981 and is headquartered in Newcastle upon Tyne, the United Kingdom.

Is this Sage's moment to breakout?Will Sage breakout of its 817 resistance, which has held for almost 5 years?

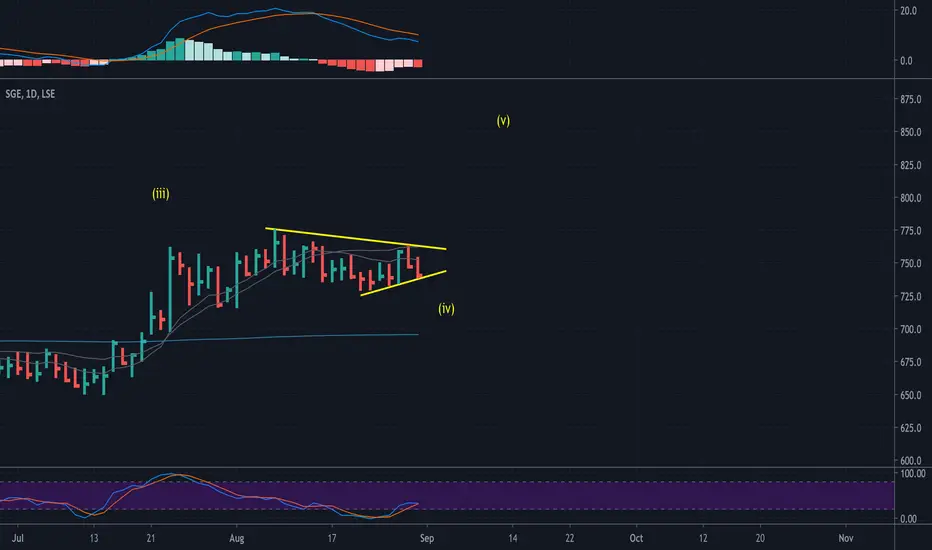
A move that might have begunIt's been a while since the stock declined in what could be the final E leg down.
Expect it to progress towards 900 now.

Accumulation of SGE at the end of correction.SGE published worse than expected numbers which triggered a 13% sell-off. It is likely the end of a corrective Wave 2. Time to start buying at this 580-ish levels to get on coming Wave 3 train.


SGE - Extended wave 4FOR INFO ONLY - NOT TRADING ADVICE
Could be a very long consolidation of wave 4. Long wave 4 means large pop up!

SGE - Sage Group - Potential buyFollowing a brutal sell off recently rolling a CEO step down, now could be the time for a long entry on SGE.
Looking at an entry above Fridays high.
Technical points:
Engulfing bar on strong volume
Rejection from lower Fib
RSI 2 oversold
May be good for a bounce.
SL: 560
TP1: 608
TP2: 630

Sage Group ready to roll over?We are on the hunt for short ideas as we expect to see some form of pullback in equities in the short term. Sage Group is in a long term downtrend and has underperformed the benchmark index over the past 1-3 months on a relative basis. The shares have rallied into downtrend resistance as well as a c


See all ideas
Trade directly on the supercharts through our supported, fully-verified and user-reviewed brokers.


Curated watchlists where SGK1 is featured.

Frequently Asked Questions
The current price of SGK1 is 12.64 EUR — it has decreased by 0.35% in the past 24 hours. Watch SAGE GROUP PLC stock price performance more closely on the chart.
Depending on the exchange, the stock ticker may vary. For instance, on GETTEX exchange SAGE GROUP PLC stocks are traded under the ticker SGK1.
SGK1 stock has fallen by 9.62% compared to the previous week, the month change is a 5.11% fall, over the last year SAGE GROUP PLC has showed a 25.10% increase.
We've gathered analysts' opinions on SAGE GROUP PLC future price: according to them, SGK1 price has a max estimate of 17.55 EUR and a min estimate of 11.35 EUR. Watch SGK1 chart and read a more detailed SAGE GROUP PLC stock forecast: see what analysts think of SAGE GROUP PLC and suggest that you do with its stocks.
SGK1 reached its all-time high on Mar 26, 2024 with the price of 15.12 EUR, and its all-time low was 3.70 EUR and was reached on Oct 10, 2013. View more price dynamics on SGK1 chart.
See other stocks reaching their highest and lowest prices.
See other stocks reaching their highest and lowest prices.
SGK1 stock is 1.66% volatile and has beta coefficient of 0.59. Track SAGE GROUP PLC stock price on the chart and check out the list of the most volatile stocks — is SAGE GROUP PLC there?
Today SAGE GROUP PLC has the market capitalization of 12.69 B, it has increased by 1.10% over the last week.
Yes, you can track SAGE GROUP PLC financials in yearly and quarterly reports right on TradingView.
SAGE GROUP PLC is going to release the next earnings report on Nov 20, 2024. Keep track of upcoming events with our Earnings Calendar.
SGK1 earnings for the last quarter are 0.21 EUR per share, whereas the estimation was 0.21 EUR resulting in a −0.45% surprise. The estimated earnings for the next quarter are 0.22 EUR per share. See more details about SAGE GROUP PLC earnings.
SAGE GROUP PLC revenue for the last quarter amounts to 1.35 B EUR despite the estimated figure of 1.36 B EUR. In the next quarter revenue is expected to reach 1.41 B EUR.
SGK1 net income for the last quarter is 182.50 M EUR, while the quarter before that showed 128.07 M EUR of net income which accounts for 42.50% change. Track more SAGE GROUP PLC financial stats to get the full picture.
SAGE GROUP PLC dividend yield was 1.95% in 2023, and payout ratio reached 93.28%. The year before the numbers were 2.64% and 72.19% correspondingly. See high-dividend stocks and find more opportunities for your portfolio.
As of May 21, 2024, the company has 11.33 K employees. See our rating of the largest employees — is SAGE GROUP PLC on this list?
EBITDA measures a company's operating performance, its growth signifies an improvement in the efficiency of a company. SAGE GROUP PLC EBITDA is 611.85 M EUR, and current EBITDA margin is 23.95%. See more stats in SAGE GROUP PLC financial statements.
Like other stocks, SGK1 shares are traded on stock exchanges, e.g. Nasdaq, Nyse, Euronext, and the easiest way to buy them is through an online stock broker. To do this, you need to open an account and follow a broker's procedures, then start trading. You can trade SAGE GROUP PLC stock right from TradingView charts — choose your broker and connect to your account.
Investing in stocks requires a comprehensive research: you should carefully study all the available data, e.g. company's financials, related news, and its technical analysis. So SAGE GROUP PLC technincal analysis shows the sell today, and its 1 week rating is sell. Since market conditions are prone to changes, it's worth looking a bit further into the future — according to the 1 month rating SAGE GROUP PLC stock shows the buy signal. See more of SAGE GROUP PLC technicals for a more comprehensive analysis.
If you're still not sure, try looking for inspiration in our curated watchlists.
If you're still not sure, try looking for inspiration in our curated watchlists.