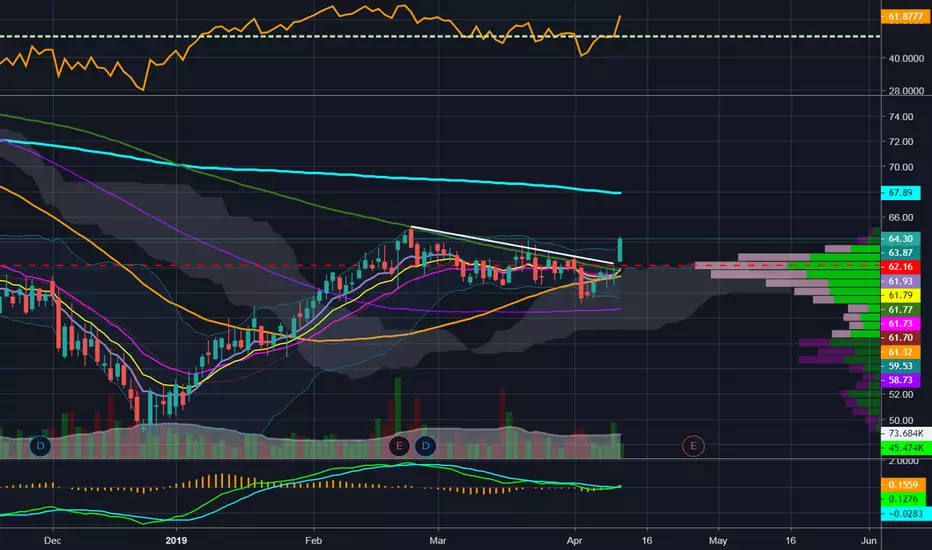
Can TNC Maintain its Upside?Technically this counter make fresh breakout currently. I think this counter could be potentially a big winner eventhough we are going under markey correction right now.
Price maintain upside above MA50
VCP pattern multiple time from base
Price BO above its VCP pattern
Macd showing positive
Next report date
—
Report period
—
EPS estimate
—
Revenue estimate
—
5.67EUR
99.21 MEUR
1.13 BEUR
18.78 M
About Tennant Company
Sector
Industry
CEO
David W. Huml
Website
Headquarters
Eden Prairie
Employees (FY)
4.46 K
Founded
1870
Tennant Co. engages in the design, manufacture, and marketing of cleaning solutions. Its products include equipment for maintaining surfaces in industrial, commercial, and outdoor environments, detergent-free and other sustainable cleaning technologies, cleaning tools and supplies, and coatings for protecting, repairing and upgrading surfaces. It operates through the following geographic segments: North America, Latin America, Europe, Middle East, Africa and Asia Pacific. The company was founded by George Henry Tennant in 1870 and is headquartered in Eden Prairie, MN.

Trade directly on the supercharts through our supported, fully-verified and user-reviewed brokers.


Curated watchlists where TN1 is featured.

Frequently Asked Questions
The current price of TN1 is 100.00 EUR — it has increased by 0.50% in the past 24 hours. Watch TENNANT CO stock price performance more closely on the chart.
Depending on the exchange, the stock ticker may vary. For instance, on GETTEX exchange TENNANT CO stocks are traded under the ticker TN1.
TENNANT CO is going to release the next earnings report on Aug 1, 2024. Keep track of upcoming events with our Earnings Calendar.
TN1 stock is 2.02% volatile and has beta coefficient of 1.31. Track TENNANT CO stock price on the chart and check out the list of the most volatile stocks — is TENNANT CO there?
TN1 earnings for the last quarter are 1.68 EUR per share, whereas the estimation was 1.31 EUR resulting in a 27.76% surprise. The estimated earnings for the next quarter are 1.70 EUR per share. See more details about TENNANT CO earnings.
TENNANT CO revenue for the last quarter amounts to 288.23 M EUR despite the estimated figure of 287.70 M EUR. In the next quarter revenue is expected to reach 308.77 M EUR.
Yes, you can track TENNANT CO financials in yearly and quarterly reports right on TradingView.
TN1 stock has fallen by 8.26% compared to the previous week, the month change is a 9.91% fall, over the last year TENNANT CO has showed a 14.29% increase.
TN1 net income for the last quarter is 26.32 M EUR, while the quarter before that showed 28.09 M EUR of net income which accounts for −6.29% change. Track more TENNANT CO financial stats to get the full picture.
Today TENNANT CO has the market capitalization of 1.89 B, it has decreased by 8.48% over the last week.
Yes, TN1 dividends are paid quarterly. The last dividend per share was 0.26 EUR. As of today, Dividend Yield (TTM)% is 1.02%. Tracking TENNANT CO dividends might help you take more informed decisions.
TENNANT CO dividend yield was 1.16% in 2023, and payout ratio reached 18.44%. The year before the numbers were 1.65% and 28.62% correspondingly. See high-dividend stocks and find more opportunities for your portfolio.
Like other stocks, TN1 shares are traded on stock exchanges, e.g. Nasdaq, Nyse, Euronext, and the easiest way to buy them is through an online stock broker. To do this, you need to open an account and follow a broker's procedures, then start trading. You can trade TENNANT CO stock right from TradingView charts — choose your broker and connect to your account.
As of May 6, 2024, the company has 4.46 K employees. See our rating of the largest employees — is TENNANT CO on this list?
We've gathered analysts' opinions on TENNANT CO future price: according to them, TN1 price has a max estimate of 130.10 EUR and a min estimate of 129.17 EUR. Watch TN1 chart and read a more detailed TENNANT CO stock forecast: see what analysts think of TENNANT CO and suggest that you do with its stocks.
EBITDA measures a company's operating performance, its growth signifies an improvement in the efficiency of a company. TENNANT CO EBITDA is 180.82 M EUR, and current EBITDA margin is 15.49%. See more stats in TENNANT CO financial statements.