BlackRock (BLK) – Wave 3 in Motion📢 BlackRock (BLK) – Wave 3 in Motion | Institutional Strength + Fibonacci 3.618 Target Ahead 💥
📅 Timeframe : Monthly (Long-term Outlook)
📍 Current Price: $1,130
🎯 Wave 3 Target: ~$3,710 (3.618 Fibonacci Extension)
🧭 Structure: Wave 3 of a larger 5-wave cycle in progress
🌀 Wave Theory Con
Key facts today
Next report date
—
Report period
—
EPS estimate
—
Revenue estimate
—
33.53 EUR
6.15 B EUR
20.19 B EUR
143.79 M
About BlackRock, Inc.
Sector
Industry
CEO
Laurence Douglas Fink
Website
Headquarters
New York
Founded
1988
ISIN
US09290D1019
FIGI
BBG01Q3TMHS2
BlackRock, Inc. engages in the provision of investment, advisory and risk management solutions. Its products include single-asset and multi-asset portfolios. The company was founded by Laurence Douglas Fink in 1988 and is headquartered in New York, NY.
Related stocks

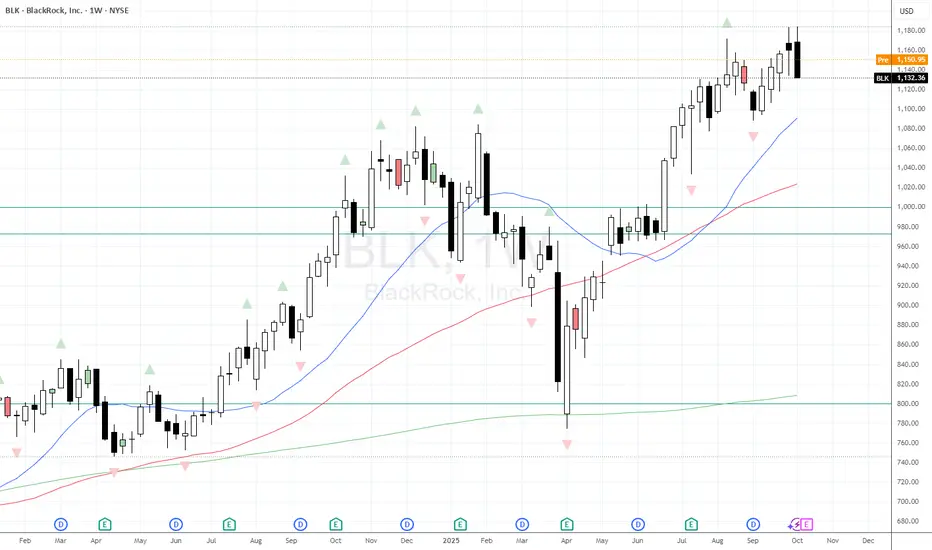
BlackRock (BLK) — holding the trend, targeting $1,200After a strong Q3 report — with Assets Under Management reaching a record $13.46 trillion — NYSE:BLK stock continues to hold within its ascending channel.
Technical setup:
Support: $1,145 – 1,150 (lower boundary of the channel)
Target: $1,200 (upper range / profit-taking zone)
MACD shows a

$BLK prints bearish Key Reversal Candle before earningsLike most finance companies NYSE:BLK has enjoyed a good few years (generally). What's interesting is that after last Fridays tariff tantrum we saw BLK print a Bearish Key Reversal on the Weekly Chart. these are rare so should always be respected. Does that mean BLK and all finance companies are go
BlackRock... Time to take advantage.Yeah that's right, it's time to buy shares of the bad guy's company. Do you really think a firm safeguarding $11 Trillion in assets is going anywhere? I wouldn't guess, which means any dip that comes along is more than likely a gift from the market. With that being said, NYSE:BLK has seen just und

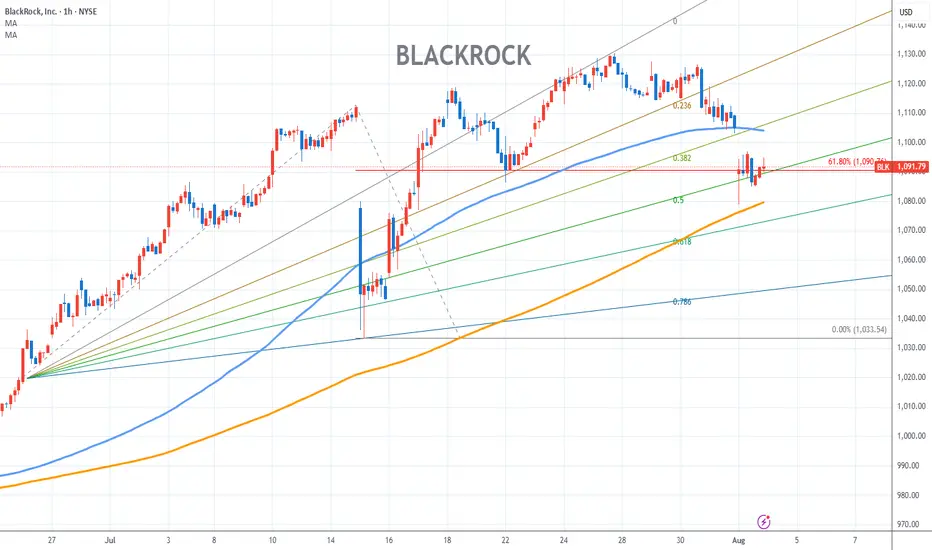
BlackRock Stock Chart Fibonacci Analysis 080125Trading Idea
1) Find a FIBO slingshot
2) Check FIBO 61.80% level
3) Entry Point > 1090/61.80%
Chart time frame:B
A) 15 min(1W-3M)
B) 1 hr(3M-6M)
C) 4 hr(6M-1year)
D) 1 day(1-3years)
Stock progress:C
A) Keep rising over 61.80% resistance
B) 61.80% resistance
C) 61.80% support
D) Hit the bottom
E
BlackrockNice trade to go long here... I have seen tidier C&H setups... But this one looks good for the coming weeks. Worth keeping an eye on

BlackRock Beats EPS Estimates Despite Revenue Miss in Q1 2025 BlackRock Inc. (NYSE: NYSE:BLK ) reported adjusted earnings per share (EPS) of $11.30 for Q1 2025. This beat the Zacks Consensus Estimate of $10.25, marking a 10.24% surprise. In the same quarter last year, EPS was $9.81.
Revenue came in at $5.28 billion, missing the estimate of $5.33 billion by 1

BLACKROCK Stock Chart Fibonacci Analysis 031725Trading Idea
1) Find a FIBO slingshot
2) Check FIBO 61.80% level
3) Entry Point > 900/61.80%
Chart time frame: C
A) 15 min(1W-3M)
B) 1 hr(3M-6M)
C) 4 hr(6M-1year)
D) 1 day(1-3years)
Stock progress: C
A) Keep rising over 61.80% resistance
B) 61.80% resistance
C) 61.80% support
D) Hit the bottom

Shorting BlackRock Back to Stone Age. BLKEllioticians will have fun with this one, because this is a debatable chart wave-wise. Now what else is going on here technically? Volumes, volatility stochastics and momentum are downgoing. Bollinger Bands are no doubt showing something bearish undergoing as well. US/vWAP cross and resting above ca

BlackRock Is About to Explode – Here’s Why I’m Going Long!📊 BlackRock (BLK) – Bullish Setup Ahead of Earnings! 📊
BlackRock ( NYSE: BLK) is setting up for a potential bullish move as it approaches tomorrow's earnings report (before market open). After a healthy pullback, the stock has bounced off a long-term trendline, showing technical signs of a revers

See all ideas
Summarizing what the indicators are suggesting.
Neutral
SellBuy
Strong sellStrong buy
Strong sellSellNeutralBuyStrong buy
Neutral
SellBuy
Strong sellStrong buy
Strong sellSellNeutralBuyStrong buy
Neutral
SellBuy
Strong sellStrong buy
Strong sellSellNeutralBuyStrong buy
An aggregate view of professional's ratings.
Neutral
SellBuy
Strong sellStrong buy
Strong sellSellNeutralBuyStrong buy
Neutral
SellBuy
Strong sellStrong buy
Strong sellSellNeutralBuyStrong buy
Neutral
SellBuy
Strong sellStrong buy
Strong sellSellNeutralBuyStrong buy
Displays a symbol's price movements over previous years to identify recurring trends.
BLK5852862
BlackRock, Inc. 5.35% 08-JAN-2055Yield to maturity
5.37%
Maturity date
Jan 8, 2055
BLK5767244
BlackRock, Inc. 5.25% 14-MAR-2054Yield to maturity
5.34%
Maturity date
Mar 14, 2054
BLK5767242
BlackRock, Inc. 5.0% 14-MAR-2034Yield to maturity
4.52%
Maturity date
Mar 14, 2034
US9247XAT8
BlackRock, Inc. 4.75% 25-MAY-2033Yield to maturity
4.50%
Maturity date
May 25, 2033
US9247XAS0
BlackRock, Inc. 2.1% 25-FEB-2032Yield to maturity
4.32%
Maturity date
Feb 25, 2032
BLK5852549
BlackRock, Inc. 4.9% 08-JAN-2035Yield to maturity
4.25%
Maturity date
Jan 8, 2035
US9247XAR2
BlackRock, Inc. 1.9% 28-JAN-2031Yield to maturity
4.22%
Maturity date
Jan 28, 2031
US9247XAQ4
BlackRock, Inc. 2.4% 30-APR-2030Yield to maturity
4.13%
Maturity date
Apr 30, 2030
BLK5767241
BlackRock, Inc. 4.7% 14-MAR-2029Yield to maturity
3.97%
Maturity date
Mar 14, 2029
US9247XAP6
BlackRock, Inc. 3.25% 30-APR-2029Yield to maturity
3.94%
Maturity date
Apr 30, 2029
BLK5852548
BlackRock, Inc. 4.6% 26-JUL-2027Yield to maturity
3.86%
Maturity date
Jul 26, 2027
See all UU2 bonds
Curated watchlists where UU2 is featured.


Frequently Asked Questions
The current price of UU2 is 932.70 EUR — it has decreased by −1.31% in the past 24 hours. Watch BlackRock, Inc. stock price performance more closely on the chart.
Depending on the exchange, the stock ticker may vary. For instance, on GETTEX exchange BlackRock, Inc. stocks are traded under the ticker UU2.
UU2 stock has fallen by −3.76% compared to the previous week, the month change is a −5.30% fall, over the last year BlackRock, Inc. has showed a 3.21% increase.
We've gathered analysts' opinions on BlackRock, Inc. future price: according to them, UU2 price has a max estimate of 1,280.80 EUR and a min estimate of 1,062.74 EUR. Watch UU2 chart and read a more detailed BlackRock, Inc. stock forecast: see what analysts think of BlackRock, Inc. and suggest that you do with its stocks.
UU2 stock is 2.23% volatile and has beta coefficient of 1.15. Track BlackRock, Inc. stock price on the chart and check out the list of the most volatile stocks — is BlackRock, Inc. there?
Today BlackRock, Inc. has the market capitalization of 152.76 B, it has decreased by −5.72% over the last week.
Yes, you can track BlackRock, Inc. financials in yearly and quarterly reports right on TradingView.
BlackRock, Inc. is going to release the next earnings report on Jan 21, 2026. Keep track of upcoming events with our Earnings Calendar.
UU2 earnings for the last quarter are 9.84 EUR per share, whereas the estimation was 9.63 EUR resulting in a 2.24% surprise. The estimated earnings for the next quarter are 11.10 EUR per share. See more details about BlackRock, Inc. earnings.
BlackRock, Inc. revenue for the last quarter amounts to 5.55 B EUR, despite the estimated figure of 5.39 B EUR. In the next quarter, revenue is expected to reach 5.84 B EUR.
UU2 net income for the last quarter is 1.13 B EUR, while the quarter before that showed 1.35 B EUR of net income which accounts for −16.63% change. Track more BlackRock, Inc. financial stats to get the full picture.
Yes, UU2 dividends are paid quarterly. The last dividend per share was 4.45 EUR. As of today, Dividend Yield (TTM)% is 1.91%. Tracking BlackRock, Inc. dividends might help you take more informed decisions.
BlackRock, Inc. dividend yield was 1.99% in 2024, and payout ratio reached 48.56%. The year before the numbers were 2.46% and 54.78% correspondingly. See high-dividend stocks and find more opportunities for your portfolio.
As of Nov 1, 2025, the company has 21.1 K employees. See our rating of the largest employees — is BlackRock, Inc. on this list?
Like other stocks, UU2 shares are traded on stock exchanges, e.g. Nasdaq, Nyse, Euronext, and the easiest way to buy them is through an online stock broker. To do this, you need to open an account and follow a broker's procedures, then start trading. You can trade BlackRock, Inc. stock right from TradingView charts — choose your broker and connect to your account.
Investing in stocks requires a comprehensive research: you should carefully study all the available data, e.g. company's financials, related news, and its technical analysis. So BlackRock, Inc. technincal analysis shows the sell today, and its 1 week rating is sell. Since market conditions are prone to changes, it's worth looking a bit further into the future — according to the 1 month rating BlackRock, Inc. stock shows the sell signal. See more of BlackRock, Inc. technicals for a more comprehensive analysis.
If you're still not sure, try looking for inspiration in our curated watchlists.
If you're still not sure, try looking for inspiration in our curated watchlists.