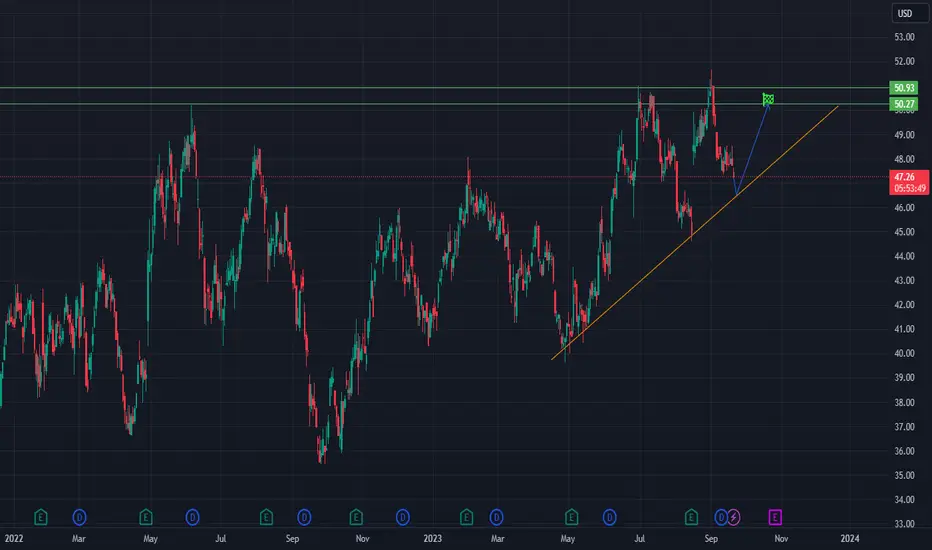
AVT long at the supportAvnet has been increasing for some time.
Entering the long position at the upsloping support may be a good idea.
Stop loss is under the upsloping line.
Target: 50,27 -50,93$
Good luck!
Next report date
—
Report period
—
EPS estimate
—
Revenue estimate
—
5.81EUR
706.70 MEUR
24.33 BEUR
89.65 M
About Avnet, Inc.
Sector
Industry
CEO
Philip R. Gallagher
Website
Headquarters
Phoenix
Employees (FY)
15.8 K
Founded
1921
Avnet, Inc. engages in the distribution and sale of electronic components. It operates through the Electronic Components and Farnell segments. The Electronic Components segment markets and sells semiconductors, interconnect, passive and electromechanical devices, and integrated components. The Farnell segment is involved in the distribution of electronic components and related products to the electronic system design community utilizing multi-channel sales and marketing resources. The company was founded by Charles Avnet in 1921 and is headquartered in Phoenix, AZ.

AVT Parallel Rejections Leading to ContinuationAs long the main trend line is (relatively) intact, bullish continuation should be the result

AVT at extreme resistance on the monthly chart!longs need to trade with extreme caution here, we have not broken resistance for 8 years now.. chances are this zone will continue to act as resistance.
targeting 36.13-30.52-25.12 from here

$AVT long firmly above avwapLooking to go long once it pops out of this consolidation
Price firmly above avwap.

Bearish on AVT we are going to $33AVT bulls looking weak! Buy Calls look great for this one
NASDAQ:AVT

Avnet - Will jump from its low The electronic distribution market is growing and there is no need to panic when demand will surge.

Avnet broke out and is ready for another leg upNASDAQ:AVT broke out and ready for another leg up. Anticipated price action is shown on the chart, stop at 35$.
Hit the like button and follow if you find this useful :)
This is only my own view and not financial advice, do your own analysis before buying or selling
Happy Trading!

AVNET Title DailyHey my friends, AVNET is in a bullish push with a large volume of buying traded and a lot of buyers. The TIMEFRAME M1 makes us notice an upside down hammer candle with a large purchase volume emitted it is leaving for testing. Then break the VWAP and come to the last low point and do a strong revers

AVT - A electronic distributor - Swing LongWhat I see...
+ Bullish engulfing on very high vol.
+ MACD found support from signal line
+ RSI bouncing off of 50
+10MA has just recently crossed above 50MA
+ Prices found support from the upward trend line
- Prices bounced off the 10MA
- Similarly, upper shadows throughout!
What I setup...
Long

See all ideas
Trade directly on the supercharts through our supported, fully-verified and user-reviewed brokers.


Frequently Asked Questions
The current price of VNI is 48.20 EUR — it has increased by 0.42% in the past 24 hours. Watch AVNET INC stock price performance more closely on the chart.
Depending on the exchange, the stock ticker may vary. For instance, on GETTEX exchange AVNET INC stocks are traded under the ticker VNI.
AVNET INC is going to release the next earnings report on Aug 7, 2024. Keep track of upcoming events with our Earnings Calendar.
VNI stock is 0.83% volatile and has beta coefficient of 0.77. Track AVNET INC stock price on the chart and check out the list of the most volatile stocks — is AVNET INC there?
VNI earnings for the last quarter are 1.02 EUR per share, whereas the estimation was 1.03 EUR resulting in a −0.90% surprise. The estimated earnings for the next quarter are 0.88 EUR per share. See more details about AVNET INC earnings.
AVNET INC revenue for the last quarter amounts to 5.24 B EUR despite the estimated figure of 5.29 B EUR. In the next quarter revenue is expected to reach 4.98 B EUR.
Yes, you can track AVNET INC financials in yearly and quarterly reports right on TradingView.
VNI stock has risen by 6.17% compared to the previous week, the month change is a 6.17% rise, over the last year AVNET INC has showed a 25.52% increase.
VNI net income for the last quarter is 82.33 M EUR, while the quarter before that showed 106.85 M EUR of net income which accounts for −22.95% change. Track more AVNET INC financial stats to get the full picture.
Today AVNET INC has the market capitalization of 4.34 B, it has decreased by 1.47% over the last week.
Yes, VNI dividends are paid quarterly. The last dividend per share was 0.29 EUR. As of today, Dividend Yield (TTM)% is 2.36%. Tracking AVNET INC dividends might help you take more informed decisions.
AVNET INC dividend yield was 2.30% in 2023, and payout ratio reached 14.05%. The year before the numbers were 2.37% and 14.42% correspondingly. See high-dividend stocks and find more opportunities for your portfolio.
Like other stocks, VNI shares are traded on stock exchanges, e.g. Nasdaq, Nyse, Euronext, and the easiest way to buy them is through an online stock broker. To do this, you need to open an account and follow a broker's procedures, then start trading. You can trade AVNET INC stock right from TradingView charts — choose your broker and connect to your account.
As of May 11, 2024, the company has 15.80 K employees. See our rating of the largest employees — is AVNET INC on this list?
Investing in stocks requires a comprehensive research: you should carefully study all the available data, e.g. company's financials, related news, and its technical analysis. So AVNET INC technincal analysis shows the buy rating today, and its 1 week rating is strong buy. Since market conditions are prone to changes, it's worth looking a bit further into the future — according to the 1 month rating AVNET INC stock shows the strong buy signal. See more of AVNET INC technicals for a more comprehensive analysis.
If you're still not sure, try looking for inspiration in our curated watchlists.
If you're still not sure, try looking for inspiration in our curated watchlists.
We've gathered analysts' opinions on AVNET INC future price: according to them, VNI price has a max estimate of 53.01 EUR and a min estimate of 37.20 EUR. Watch VNI chart and read a more detailed AVNET INC stock forecast: see what analysts think of AVNET INC and suggest that you do with its stocks.
EBITDA measures a company's operating performance, its growth signifies an improvement in the efficiency of a company. AVNET INC EBITDA is 1.08 B EUR, and current EBITDA margin is 5.12%. See more stats in AVNET INC financial statements.