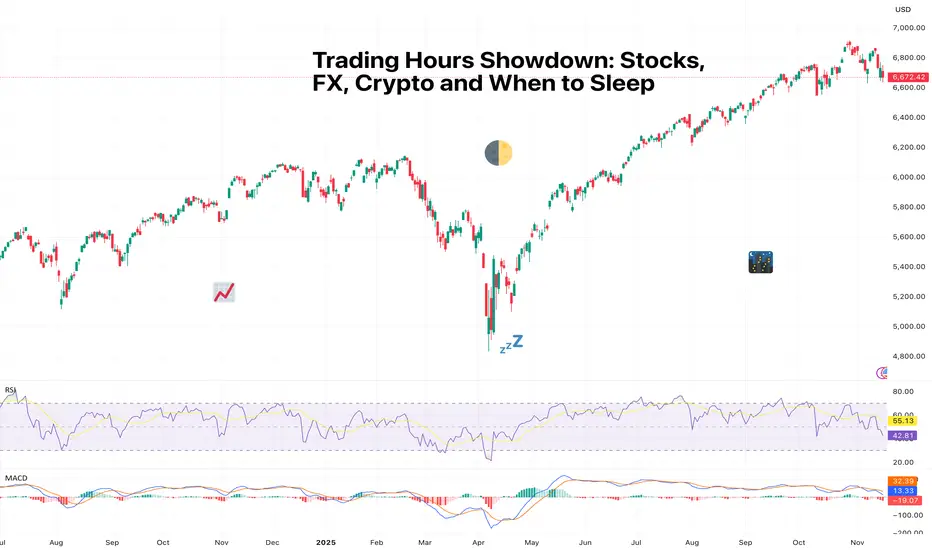
Trading Hours Showdown: Stocks, FX, Crypto and When to SleepSome markets close, some don’t, and some don’t care that you need rest.
If financial markets were people, they’d each have wildly different sleeping habits. Stocks tuck themselves in usually at 4 p.m. (that is, where they originate from), FX stays up all night but insists it’s “fine,” and crypto i
About S&P 500 Index
Standard and Poor's 500 Index is a capitalization-weighted stock market index measuring the performance of 500 large publicly traded companies in the United States. This index covers a wide range of industries, including technology, healthcare, energy, and finance. It serves as a benchmark for the overall health of the U.S. stock market, as well as a reflection of the country's economic strength.
Substantial gains in the S&P 500 are often interpreted as positive signals for the economy, while losses can be seen as indicators of potential trouble. Investors use this index as a barometer for their own portfolios and to assess the performance of individual stocks. The S&P 500 index plays a vital role in the financial world and is closely watched by analysts and policymakers.
Substantial gains in the S&P 500 are often interpreted as positive signals for the economy, while losses can be seen as indicators of potential trouble. Investors use this index as a barometer for their own portfolios and to assess the performance of individual stocks. The S&P 500 index plays a vital role in the financial world and is closely watched by analysts and policymakers.
Related indices
SPX 500: Bullish Rebound to 6760?FX:SPX500 is priming for a bullish rebound on the 4-hour chart , where price has pulled back to a critical support zone following a sharp decline, forming a potential bounce setup amid a broader uptrend—highlighted by the rebound pattern near key levels that could ignite buying if buyers defend

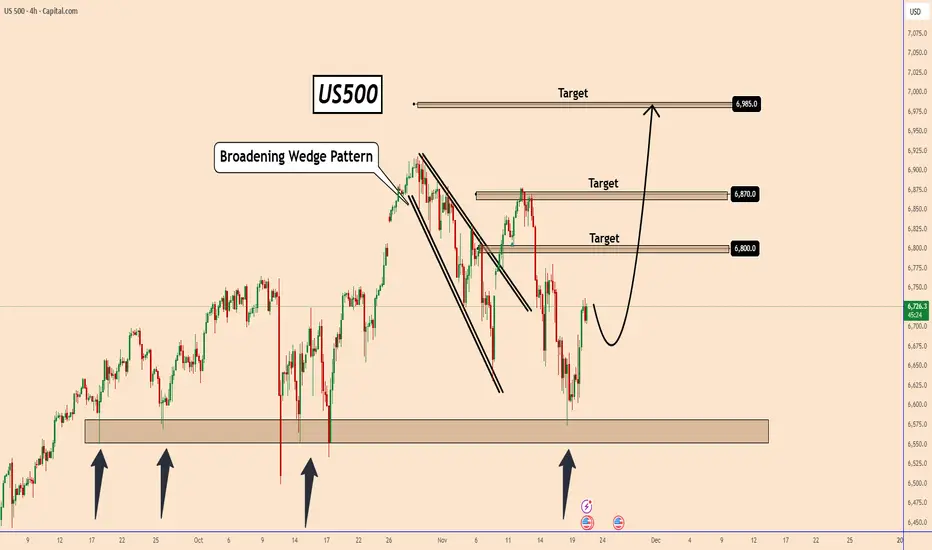
US500: Strong Reversal Zone Holding | Potential Rally AheadUS500 – Strong Reversal Zone Holding | Potential Rally Ahead
US500 has once again reacted strongly from the major support zone marked on the chart — an area that has held multiple times in the past.
Buyers stepped in aggressively, preventing further downside and maintaining the broader bullish s
Hellena | SPX500 (4H): LONG to resistance area of 6775.Dear colleagues, according to the last forecast the price is at the support level, but as it turned out, the correction in wave “4” is a bit more complicated than I thought.
Wave “4” consists of three waves “ABC” and should be over soon. The upward movement is still in priority, but I will target t

S&P 500 Reversal Roadmap: Second Bottom Forming at PRZ?As I expected in the previous idea , the S&P 500 index has indeed reached its targets after breaking through the Support lines .
Currently, the S&P 500 is approaching the Support zone($6,580_$6,490) , Potential Reversal Zone (PRZ) , and the 100_SMA(Daily) .
There’s a possibility of forming

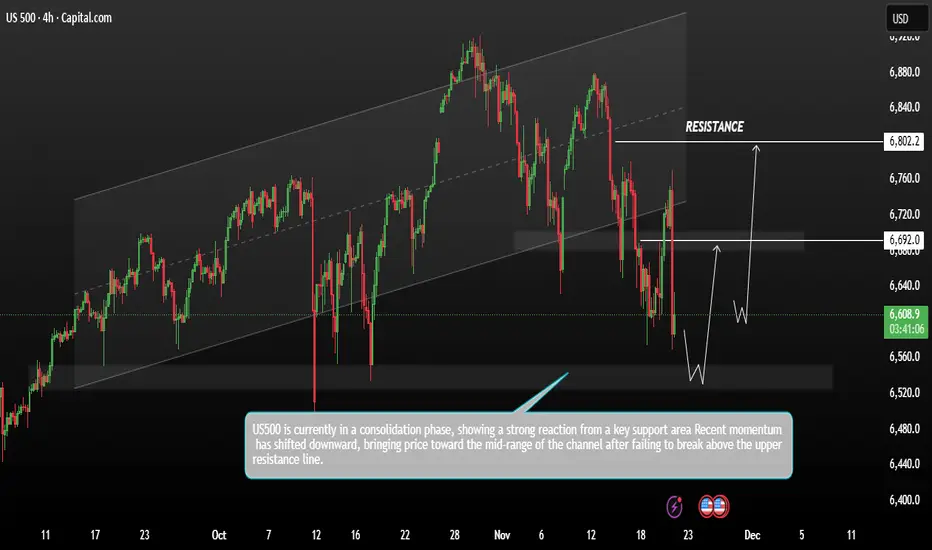
US500 Price Showing Bullish forming a reversal patternUS500 price action moving within a broad ascending channel, with multiple touches on both the upper and lower trend boundaries. Recent momentum has shifted downward, bringing price toward the mid-range of the channel after failing to break above the upper resistance line.
A key support zone sits ar
SPX - Hours Of Work To Buy 1 ShareHours of work needed to buy just one share of the S&P 500 just hit a new all-time high: 187 hours.
That’s:
150% more work than 2007
60% more than pre-COVID (2019)
10% more than “Liberation Day”
As I tell my kids:
Don’t look at the price tag.
Look at how many hours of your life — your

SPX Possibly Breaking SupportPreviously support held on this Higher Low, but it is now creating a bear trend by showing us a Lower High, and now breaking support to possibly create a Lower Low. Wait for a retest on the support which will act as resistance, or on the trendline for a low risk short entry. Feel free to drop your t

7K End Of Year $SPX Rally into Bearish Deep Crab Plummet? Let's see if this pattern plays out with the Administration touting "money printing" to stimulate the economy, while jobs and the economy are in major decline. Not trading or investment advice. Entertainment only.

S&P500 H4 | Bearish Reaction off Key ResistanceMomentum: Bearish
Price is currently below the ichimoku cloud.
Sell entry: 6,706.19
- Strong pullback resistance
- 61.8% Fib retracement
- 100% Fib projection
Stop Loss: 6,790.06
- Swing high resistance
Take Profit: 6,602.91
- Swing low support
High Risk Investment Warning
Stratos Markets Limit

See all ideas
Summarizing what the indicators are suggesting.
Oscillators
Neutral
SellBuy
Strong sellStrong buy
Strong sellSellNeutralBuyStrong buy
Oscillators
Neutral
SellBuy
Strong sellStrong buy
Strong sellSellNeutralBuyStrong buy
Summary
Neutral
SellBuy
Strong sellStrong buy
Strong sellSellNeutralBuyStrong buy
Summary
Neutral
SellBuy
Strong sellStrong buy
Strong sellSellNeutralBuyStrong buy
Summary
Neutral
SellBuy
Strong sellStrong buy
Strong sellSellNeutralBuyStrong buy
Moving Averages
Neutral
SellBuy
Strong sellStrong buy
Strong sellSellNeutralBuyStrong buy
Moving Averages
Neutral
SellBuy
Strong sellStrong buy
Strong sellSellNeutralBuyStrong buy
Displays a symbol's price movements over previous years to identify recurring trends.
Frequently Asked Questions
The current value of S&P 500 Index is 6,602.98 USD — it has risen by 0.98% in the past 24 hours. Track the index more closely on the S&P 500 Index chart.
S&P 500 Index reached its highest quote on Oct 29, 2025 — 6,920.34 USD. See more data on the S&P 500 Index chart.
The lowest ever quote of S&P 500 Index is 2.73 USD. It was reached on Jun 1, 1877. See more data on the S&P 500 Index chart.
S&P 500 Index value has decreased by −1.04% in the past week, since last month it has shown a −2.05% decrease, and over the year it's increased by 11.15%. Keep track of all changes on the S&P 500 Index chart.
The top companies of S&P 500 Index are NASDAQ:NVDA, NASDAQ:AAPL, and NASDAQ:GOOG — they can boast market cap of 4.35 T USD, 4.01 T USD, and 3.62 T USD accordingly.
The highest-priced instruments on S&P 500 Index are NYSE:NVR, NASDAQ:BKNG, and NYSE:AZO — they'll cost you 7,388.82 USD, 4,768.00 USD, and 3,897.88 USD accordingly.
The champion of S&P 500 Index is NASDAQ:HOOD — it's gained 189.02% over the year.
The weakest component of S&P 500 Index is NASDAQ:FISV — it's lost −72.13% over the year.
S&P 500 Index is just a number that lets you track performance of the instruments comprising the index, so you can't invest in it directly. But you can buy S&P 500 Index futures or funds or invest in its components.
The S&P 500 Index is comprised of 503 instruments including NASDAQ:NVDA, NASDAQ:AAPL, NASDAQ:GOOG and others. See the full list of S&P 500 Index components to find more opportunities.