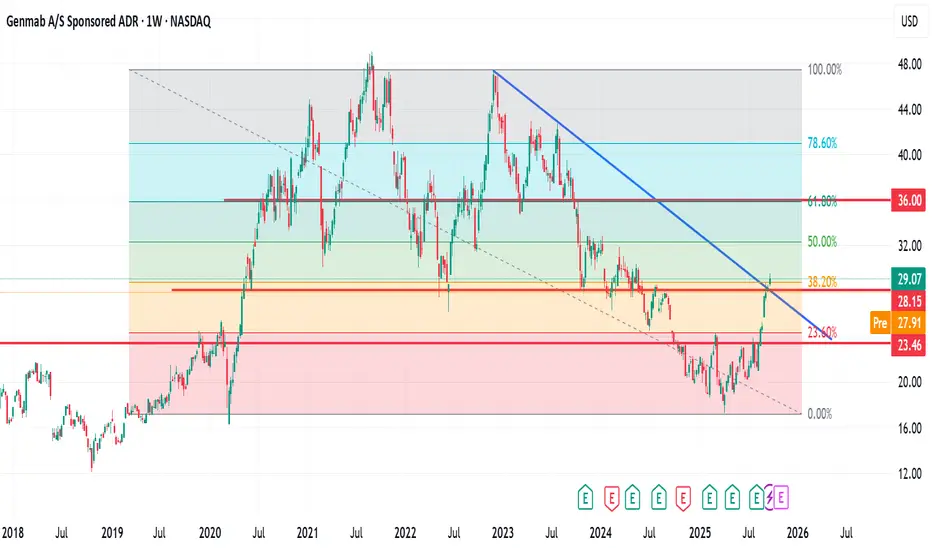
GMAB at a Critical Confluence Zone – Potential UP or down?GMAB at a Critical Confluence Zone – Potential Breakout or Reversal?
GMAB has shown strong recovery momentum since its April 7th, 2025, low. The price is currently testing a significant confluence area formed by a descending trendline and the Fib 38.2% support level.
If price action holds above th
Genmab A/S
No trades
Next report date
—
Report period
—
EPS estimate
—
Revenue estimate
—
25.06 USD
1.09 B USD
2.98 B USD
58.40 M
About Genmab A/S
Sector
Industry
CEO
Jan G. J. van de Winkel
Website
Headquarters
Copenhagen
Founded
1998
IPO date
Oct 1, 2000
Identifiers
2
ISIN DK0010272202
Genmab A/S is an international biotechnology company, which engages in the development of human antibody therapeutics for the treatment of cancer and other diseases. Its product pipeline includes daratumumab, marketed as DARZALEX for the treatment of certain indications of multiple myeloma, teprotumumab-trbw marketed as TEPEZZA for the treatment of thyroid eye disease, and ofatumumab, marketed as Arzerra for the treatment of certain indications of chronic lymphocytic leukemia. The company was founded by Donald Lee Drakeman, Florian Schonharting, and Jan G. J. van de Winkel on June 11, 1998, and is headquartered in Copenhagen, Denmark.
Related stocks
GMAB - Top Fundamental Quality + Strong Uptrend**Title: GMAB - Top Fundamental Quality + Strong Uptrend | Long Entry $29.10**
---
**📈 Ticker:** GMAB (Genmab A/S)
**📍 Recommendation:** LONG
**⏰ Timeframe:** Position Trade (2-8 weeks)
---
### **🎯 Trade Idea Summary**
- **Entry:** $29.10 (on pullback to support)
- **Stop Loss:** $25.99

Genmab 4h longZone + 1st measured move PB.
Could potentially go all the way up to the expanding triangle top?

GMAB / GENMAB / Likely this is the scenarioThe last 10 Years give us an idea how this stock moves.
Today i bough some expecting around 20% profit until End of July.
I look at Seasonality / seasonal price tendencies and identified a good period to be long in that stock. I have confidence in that and my entry was the break of yesterday candle.

GENMAB Buy scenarioI am loking to get into a buy at best after the downward trendline is broken and the SMA(89) is crossed to the upside afterwards.
See examples in the past as indicated by my green circles...
Leave a like or comment, please

Watch out for long position in GenmabGenmab has reached an important area, which before in time have been a good time to start a long postion.

Genmap Correction -40 %I like Genmab. The stock was one of my long positions for many years. I went into cash in the fall of 2021. After minus 40 percent, I will now gradually add to Genmab again.

Genmab is a era done ?I have sold all of my genmab shares i started to buy at the start of corona, 5 year tmeframe i think we see a head an shoulder formation an hoping to buy again 15-1600 kr :)

in the stockHello again, i bought this stock last year at like 1500 kr, but unf. i see a Head an should forming in think it will fall a little back, of course i hope im wrong an go up from here :) An not selling holding at least 5-20 years :)

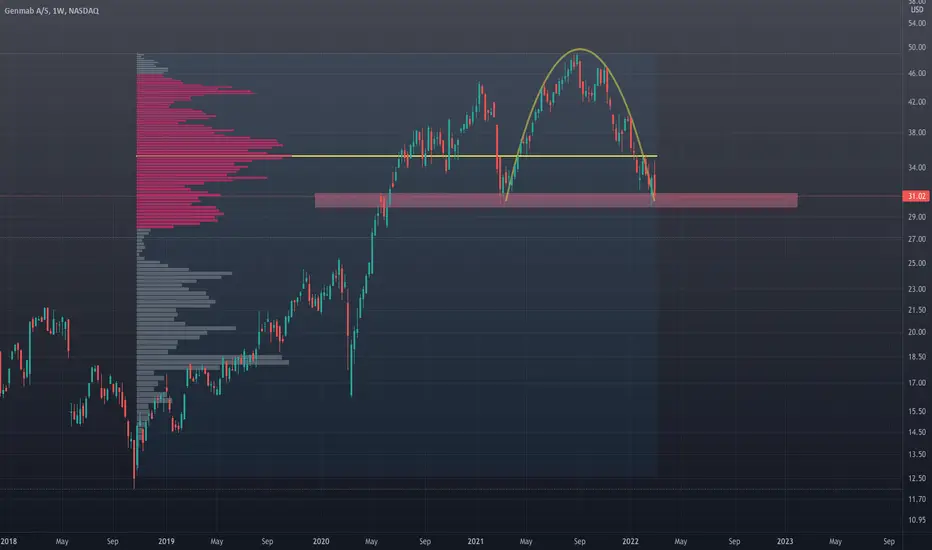
Inverse Cup and handle on the weekly $GMABInverse Cup and handle on the weekly $GMAB
- Inverse Cup and handle on the weekly
- VPVR acting as resistance
- Waiting for a trigger
See all ideas
Summarizing what the indicators are suggesting.
Neutral
SellBuy
Strong sellStrong buy
Strong sellSellNeutralBuyStrong buy
Neutral
SellBuy
Strong sellStrong buy
Strong sellSellNeutralBuyStrong buy
Neutral
SellBuy
Strong sellStrong buy
Strong sellSellNeutralBuyStrong buy
An aggregate view of professional's ratings.
Neutral
SellBuy
Strong sellStrong buy
Strong sellSellNeutralBuyStrong buy
Neutral
SellBuy
Strong sellStrong buy
Strong sellSellNeutralBuyStrong buy
Neutral
SellBuy
Strong sellStrong buy
Strong sellSellNeutralBuyStrong buy
Displays a symbol's price movements over previous years to identify recurring trends.
GMXAY6238867
Genmab A/S 7.25% 15-DEC-2033Yield to maturity
6.43%
Maturity date
Dec 15, 2033
GMXAY6238865
Genmab A/S 6.25% 15-DEC-2032Yield to maturity
5.76%
Maturity date
Dec 15, 2032
See all GNMSF bonds
Frequently Asked Questions
The current price of GNMSF is 300.00 USD — it has decreased by −2.60% in the past 24 hours. Watch Genmab A/S stock price performance more closely on the chart.
Depending on the exchange, the stock ticker may vary. For instance, on OTC exchange Genmab A/S stocks are traded under the ticker GNMSF.
GNMSF stock has fallen by −9.26% compared to the previous week, the month change is a −10.34% fall, over the last year Genmab A/S has showed a 57.51% increase.
We've gathered analysts' opinions on Genmab A/S future price: according to them, GNMSF price has a max estimate of 480.00 USD and a min estimate of 204.94 USD. Watch GNMSF chart and read a more detailed Genmab A/S stock forecast: see what analysts think of Genmab A/S and suggest that you do with its stocks.
GNMSF reached its all-time high on Sep 2, 2021 with the price of 500.92 USD, and its all-time low was 3.30 USD and was reached on Dec 3, 2009. View more price dynamics on GNMSF chart.
See other stocks reaching their highest and lowest prices.
See other stocks reaching their highest and lowest prices.
GNMSF stock is 2.67% volatile and has beta coefficient of 0.59. Track Genmab A/S stock price on the chart and check out the list of the most volatile stocks — is Genmab A/S there?
Today Genmab A/S has the market capitalization of 18.37 B, it has decreased by −7.19% over the last week.
Yes, you can track Genmab A/S financials in yearly and quarterly reports right on TradingView.
Genmab A/S is going to release the next earnings report on May 7, 2026. Keep track of upcoming events with our Earnings Calendar.
GNMSF earnings for the last quarter are 4.71 USD per share, whereas the estimation was 4.44 USD resulting in a 6.25% surprise. The estimated earnings for the next quarter are 2.16 USD per share. See more details about Genmab A/S earnings.
Genmab A/S revenue for the last quarter amounts to 1.06 B USD, despite the estimated figure of 1.05 B USD. In the next quarter, revenue is expected to reach 902.63 M USD.
GNMSF net income for the last quarter is 401.57 M USD, while the quarter before that showed 348.45 M USD of net income which accounts for 15.25% change. Track more Genmab A/S financial stats to get the full picture.
No, GNMSF doesn't pay any dividends to its shareholders. But don't worry, we've prepared a list of high-dividend stocks for you.
As of Feb 12, 2026, the company has 2.68 K employees. See our rating of the largest employees — is Genmab A/S on this list?
EBITDA measures a company's operating performance, its growth signifies an improvement in the efficiency of a company. Genmab A/S EBITDA is 1.45 B USD, and current EBITDA margin is 34.45%. See more stats in Genmab A/S financial statements.
Like other stocks, GNMSF shares are traded on stock exchanges, e.g. Nasdaq, Nyse, Euronext, and the easiest way to buy them is through an online stock broker. To do this, you need to open an account and follow a broker's procedures, then start trading. You can trade Genmab A/S stock right from TradingView charts — choose your broker and connect to your account.
Investing in stocks requires a comprehensive research: you should carefully study all the available data, e.g. company's financials, related news, and its technical analysis. So Genmab A/S technincal analysis shows the sell today, and its 1 week rating is neutral. Since market conditions are prone to changes, it's worth looking a bit further into the future — according to the 1 month rating Genmab A/S stock shows the buy signal. See more of Genmab A/S technicals for a more comprehensive analysis.
If you're still not sure, try looking for inspiration in our curated watchlists.
If you're still not sure, try looking for inspiration in our curated watchlists.