HII - Wave BreakdownContinuing the idea on Huntington Ingalls Industries’ growth, let’s take a closer look at the current wave.
This is a classic five-wave structure, and we are now developing the final wave 5 .
Target range is between 355 and 390 , or potentially higher.
Afterwards, a gradual correction of the
Next report date
—
Report period
—
EPS estimate
—
Revenue estimate
—
14.48 USD
550.00 M USD
11.54 B USD
38.84 M
About Huntington Ingalls Industries, Inc.
Sector
Industry
CEO
Christopher D. Kastner
Website
Headquarters
Newport News
Founded
2010
IPO date
Mar 19, 2011
Identifiers
3
ISIN US4464131063
Huntington Ingalls Industries, Inc. engages in the shipbuilding business. It operates through the following business segments: Ingalls, Newport News, and Mission Technologies. The Ingalls segment designs and constructs non-nuclear ships, including amphibious assault ships, expeditionary warfare ships, surface combatants, and national security cutters (NSC). The Newport News segment designs and builds nuclear-powered aircraft carriers and submarines, and the refueling and overhaul and the inactivation of nuclear-powered aircraft carriers. The Mission Technologies segment includes business groups focused on high-end information technology (IT) and mission-based solutions for DoD, intelligence, and federal civilian customers, life-cycle sustainment services to the U.S. Navy fleet and other maritime customers, unmanned, autonomous systems, and nuclear management and operations and environmental management services for the Department of Energy (DoE), DoD, state and local governments, and private sector companies. The company was founded on August 4, 2010 and is headquartered in Newport News, VA.
Related stocks

Can One Shipbuilder Anchor America's Naval Supremacy?Huntington Ingalls Industries (HII) stands at the nexus of America's resurgent naval strategy, positioning itself not as a legacy shipbuilder but as a cutting-edge technology integrator. With exclusive control of the Arleigh Burke Flight III destroyer program featuring the revolutionary SPY-6 radar,

HII - High PotentialFrom early October 2011 to February 2018, Huntington Ingalls Industries was in a growth phase.
This was followed by a prolonged correction lasting from February 2018 to February 2025.
During this corrective phase, the price dropped by more than 50% and overlapped the sub-wave 1 , confirming the co

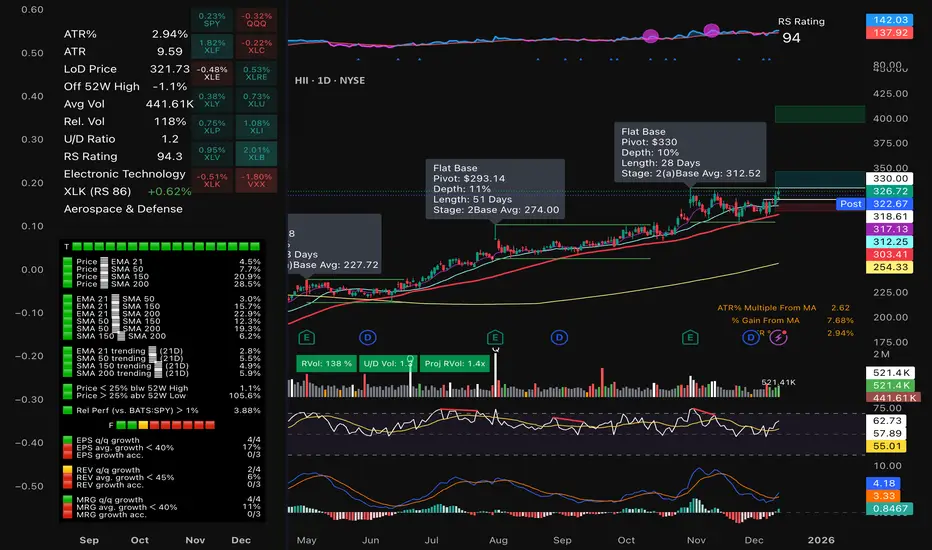
Trade Idea: HII - Flat Base Breakout in Strong Sector (Defense) Trade Idea: HII – Flat Base Breakout in Strong Sector (Defense)
Ticker: NYSE:HII
Sector: Industrials – Aerospace & Defense
Trade Type: Breakout Swing
Thesis:
HII is forming a flat base just below all-time highs, within a high relative strength sector (Defense), as small caps and industrials ro
HII Long Trade – Warship of a Breakout! “Not all battles are fo⚓🛳️ 🌊⚔️📈
NYSE:HII – the builder of America’s most powerful warships – just breached a technical triangle like a submarine breaching the surface 🚢🔺
Is this just a chart pattern… or is it the start of a geopolitical move? 🤫
When the world is on edge, maritime defense matters more than ever.
📌 Tr

$HII Earnings Beat and Breakout ContinuationI have been long this name since April 17th. I held through earnings as it has been a slow but steady gainer.
Revenue did fall about 2% YOY. However, this is a good candidate for the new ship building initiative.
If you like this idea, please make it your own and be sure to follow "your" rules of

$HII - Shipbuilding - gap fill idea.Looking for a continuation and gap fill on $HII. Trump admin looking to return shipbuilding to the US. Strong curling of MACD/RSI. Pretty simple thesis.

$HII for a 90%+ profit.RSI is in the buy zone. P/E and P/B are in a beautiful buy range too. Sell at the red line.

Bad earnings, catalyst delay, and TA RESET.All indicators point in one direction as the stock continues to fall after the initial good catalyst but has been marred by more bad news, with stochastic heading down and other indicators now also pointing in the direction of a bearish move, support areas remain key.

Missa da Requiem ~MiserereWeekly Chart, so this May take a while.
but it will be worth it!
Short, at $255ish, Cover $219 or Lower. Juice with some PUTS, Lemon, ice gently Shaken, not Stirred
yippee Ki-yay... Hombres
A planet of playthings, we dance on the strings of powers we cannot perceive

See all ideas
Summarizing what the indicators are suggesting.
Neutral
SellBuy
Strong sellStrong buy
Strong sellSellNeutralBuyStrong buy
Neutral
SellBuy
Strong sellStrong buy
Strong sellSellNeutralBuyStrong buy
Neutral
SellBuy
Strong sellStrong buy
Strong sellSellNeutralBuyStrong buy
An aggregate view of professional's ratings.
Neutral
SellBuy
Strong sellStrong buy
Strong sellSellNeutralBuyStrong buy
Neutral
SellBuy
Strong sellStrong buy
Strong sellSellNeutralBuyStrong buy
Neutral
SellBuy
Strong sellStrong buy
Strong sellSellNeutralBuyStrong buy
Displays a symbol's price movements over previous years to identify recurring trends.
HII5939588
Huntington Ingalls Industries, Inc. 5.749% 15-JAN-2035Yield to maturity
4.93%
Maturity date
Jan 15, 2035
HII5088072
Huntington Ingalls Industries, Inc. 4.2% 01-MAY-2030Yield to maturity
4.43%
Maturity date
May 1, 2030
HII5939587
Huntington Ingalls Industries, Inc. 5.353% 15-JAN-2030Yield to maturity
4.37%
Maturity date
Jan 15, 2030
HII5444418
Huntington Ingalls Industries, Inc. 2.043% 16-AUG-2028Yield to maturity
4.15%
Maturity date
Aug 16, 2028
HII4636809
Huntington Ingalls Industries, Inc. 3.483% 01-DEC-2027Yield to maturity
4.06%
Maturity date
Dec 1, 2027
HII5237290
Huntington Ingalls Industries, Inc. 2.043% 16-AUG-2028Yield to maturity
—
Maturity date
Aug 16, 2028
See all HII bonds
Frequently Asked Questions
The current price of HII is 427.83 USD — it has increased by 0.61% in the past 24 hours. Watch Huntington Ingalls Industries, Inc. stock price performance more closely on the chart.
Depending on the exchange, the stock ticker may vary. For instance, on NYSE exchange Huntington Ingalls Industries, Inc. stocks are traded under the ticker HII.
HII stock has risen by 1.29% compared to the previous week, the month change is a 21.34% rise, over the last year Huntington Ingalls Industries, Inc. has showed a 119.05% increase.
We've gathered analysts' opinions on Huntington Ingalls Industries, Inc. future price: according to them, HII price has a max estimate of 450.00 USD and a min estimate of 292.00 USD. Watch HII chart and read a more detailed Huntington Ingalls Industries, Inc. stock forecast: see what analysts think of Huntington Ingalls Industries, Inc. and suggest that you do with its stocks.
HII stock is 2.98% volatile and has beta coefficient of 0.71. Track Huntington Ingalls Industries, Inc. stock price on the chart and check out the list of the most volatile stocks — is Huntington Ingalls Industries, Inc. there?
Today Huntington Ingalls Industries, Inc. has the market capitalization of 16.69 B, it has increased by 0.29% over the last week.
Yes, you can track Huntington Ingalls Industries, Inc. financials in yearly and quarterly reports right on TradingView.
Huntington Ingalls Industries, Inc. is going to release the next earnings report on Feb 5, 2026. Keep track of upcoming events with our Earnings Calendar.
HII earnings for the last quarter are 3.68 USD per share, whereas the estimation was 3.30 USD resulting in a 11.67% surprise. The estimated earnings for the next quarter are 3.87 USD per share. See more details about Huntington Ingalls Industries, Inc. earnings.
Huntington Ingalls Industries, Inc. revenue for the last quarter amounts to 3.19 B USD, despite the estimated figure of 2.95 B USD. In the next quarter, revenue is expected to reach 3.09 B USD.
HII net income for the last quarter is 145.00 M USD, while the quarter before that showed 152.00 M USD of net income which accounts for −4.61% change. Track more Huntington Ingalls Industries, Inc. financial stats to get the full picture.
Yes, HII dividends are paid quarterly. The last dividend per share was 1.38 USD. As of today, Dividend Yield (TTM)% is 1.28%. Tracking Huntington Ingalls Industries, Inc. dividends might help you take more informed decisions.
Huntington Ingalls Industries, Inc. dividend yield was 2.78% in 2024, and payout ratio reached 37.61%. The year before the numbers were 1.93% and 29.41% correspondingly. See high-dividend stocks and find more opportunities for your portfolio.
As of Jan 30, 2026, the company has 44 K employees. See our rating of the largest employees — is Huntington Ingalls Industries, Inc. on this list?
EBITDA measures a company's operating performance, its growth signifies an improvement in the efficiency of a company. Huntington Ingalls Industries, Inc. EBITDA is 864.00 M USD, and current EBITDA margin is 6.96%. See more stats in Huntington Ingalls Industries, Inc. financial statements.
Like other stocks, HII shares are traded on stock exchanges, e.g. Nasdaq, Nyse, Euronext, and the easiest way to buy them is through an online stock broker. To do this, you need to open an account and follow a broker's procedures, then start trading. You can trade Huntington Ingalls Industries, Inc. stock right from TradingView charts — choose your broker and connect to your account.
Investing in stocks requires a comprehensive research: you should carefully study all the available data, e.g. company's financials, related news, and its technical analysis. So Huntington Ingalls Industries, Inc. technincal analysis shows the buy rating today, and its 1 week rating is strong buy. Since market conditions are prone to changes, it's worth looking a bit further into the future — according to the 1 month rating Huntington Ingalls Industries, Inc. stock shows the strong buy signal. See more of Huntington Ingalls Industries, Inc. technicals for a more comprehensive analysis.
If you're still not sure, try looking for inspiration in our curated watchlists.
If you're still not sure, try looking for inspiration in our curated watchlists.