US30 trade ideas

check the trend It is expected that after the completion of the current uptrend at the resistance levels, the continuation of the corrective trend is likely.
As long as the index fluctuates above the support level of 78.6%, the possibility of a downward trend will be low.

US30 longMonthly;
We had a monthly candlestick closure that is very indecisive and we cannot tell if price is headed upwards or downwards
Weekly;
The previous week's candlestick closed above 38,500 which is a major liquidity region
The next major region is 39,100 (which is also the daily region)
There is also a head and shoulders formation which indicates that price is headed upwards
Daily;
From a daily perspective, I expect price to continue going upwards.
However, there is a chance of seeing a retest of 38620, which is a major region of support.
Price may test 38620 before going upwards so as to collect orders.
Since there is no sign of retracement, I just have to sit on my hands and wait.
4 hour;
38,715 is such a massive region where orders are collected.
For now I am sitting on my hands as I wait for price to fully show me what is happening.

US30 H4 | Bearish drop?Based on the H4 chart analysis, we can see that the price is rising toward our sell entry at 39,353, which is a pullback resistance close to 61.8% Fivo retracement.
Our take profit will be at 38,617 a supoprt support level.
The stop loss will be placed at 39,898, an overlap resistance level.
High Risk Investment Warning
Trading Forex/CFDs on margin carries a high level of risk and may not be suitable for all investors. Leverage can work against you.
Stratos Markets Limited (www.fxcm.com):
CFDs are complex instruments and come with a high risk of losing money rapidly due to leverage. 68% of retail investor accounts lose money when trading CFDs with this provider. You should consider whether you understand how CFDs work and whether you can afford to take the high risk of losing your money.
Stratos Europe Ltd, previously FXCM EU Ltd (www.fxcm.com):
CFDs are complex instruments and come with a high risk of losing money rapidly due to leverage. 70% of retail investor accounts lose money when trading CFDs with this provider. You should consider whether you understand how CFDs work and whether you can afford to take the high risk of losing your money.
Stratos Trading Pty. Limited (www.fxcm.com):
Trading FX/CFDs carries significant risks. FXCM AU (AFSL 309763), please read the Financial Services Guide, Product Disclosure Statement, Target Market Determination and Terms of Business at www.fxcm.com
Stratos Global LLC (www.fxcm.com):
Losses can exceed deposits.
Please be advised that the information presented on TradingView is provided to FXCM (‘Company’, ‘we’) by a third-party provider (‘TFA Global Pte Ltd’). Please be reminded that you are solely responsible for the trading decisions on your account. There is a very high degree of risk involved in trading. Any information and/or content is intended entirely for research, educational and informational purposes only and does not constitute investment or consultation advice or investment strategy. The information is not tailored to the investment needs of any specific person and therefore does not involve a consideration of any of the investment objectives, financial situation or needs of any viewer that may receive it. Kindly also note that past performance is not a reliable indicator of future results. Actual results may differ materially from those anticipated in forward-looking or past performance statements. We assume no liability as to the accuracy or completeness of any of the information and/or content provided herein and the Company cannot be held responsible for any omission, mistake nor for any loss or damage including without limitation to any loss of profit which may arise from reliance on any information supplied by TFA Global Pte Ltd.
The speaker(s) is neither an employee, agent nor representative of FXCM and is therefore acting independently. The opinions given are their own, constitute general market commentary, and do not constitute the opinion or advice of FXCM or any form of personal or investment advice. FXCM neither endorses nor guarantees offerings of third party speakers, nor is FXCM responsible for the content, veracity or opinions of third-party speakers, presenters or participants.

CHART BREAKDOWN US30: Key Levels, Targets and Thoughts!Brief Description🖊️:
The chart provides insights into critical market levels, emphasizing an essential supply zone (medium-risk sell zone) spanning from 39000 to 39140, respectively, are highlighted.
Things I Have Seen👀:
Medium-Risk Sell Zone🟠: Noted between 39000 and 39140, suggesting another area with moderate risk for potential selling positions.
Bearish Targets📉:
40000: Possible retracement area.
39900: Possible retracement area.
39800: Area with laying low liquidity.
Ultimate Target: 39600- Essential Demand Zone
What's Important Now❗
Currently, the crucial approach is to wait and observe the price action at this level. We need to assess how the market reacts before considering any decisive moves. Stay observant and responsive to real-time developments in the market.

Us30We looking for buying opportunities as we are outside the bullish trend that was broken out by the market resulting in a change of trend which Leds to buys

DJ with no data + Things to RepeatFun fact: I dont know what happened to all that movement from last week, i m also pretty sure I m not an alien, but I had more data on friday which dissappeared...
Checklist to repeat:
1. Do I have a clear direction?
2. Is momentum going towards my direction already, or do I want to enter premomentum? If so, do I have confirmation of general (higher timeframe) momentum -> candle /wig size, candle pattern
3. Entry - is this the right entry for an upcoming idea (do not chase old ideas, if you missed entry there are 100 new ones)
If yes, yes, yes and News is ok, pull the trigger.

US30 Trading Plan - 02/Jun/2024Hello Traders,
Hope you all are doing good!!
I expect US30 to go Up after finishing the correction.
Currently US30 has given a nice impulse showing us that buyers are interested to enter the market for pushing US30 upside.
Plan to Trade:
If market starts to correct from current levels without going further to 39k level, then any correction towards highlighted zone will be a potential BUY.
The first target level to look for reaction will be 39k & if it corrects here then the next target will be around 39.5k level.
If market keeps on pushing towards 39k level before start to correct, then any correction to highlighted zone will be a potential BUY.
In this case the target will be 39.5k level.
Look for your BUY entry setups as per the above expectations.
Your follow and like will be a token of appreciation.
Disclaimer: This is just an idea. Please do your own analysis before opening a position. Always use SL & proper risk management.
Market can evolve anytime, hence, always do your analysis and learn trade management before following any idea.

US30US30 already break the 4H EMA. I'll be looking for retracement on US Session. Based on Fibo and EMA on these area for entry area.

The Mechanics Of Trading - Part IVPart IV - Decision Making (A vs B)
I started this video because a friend asked me for help determining trends on multi-interval (time frames) and asked how I look at trading across multiple intervals. Asking how to best setup/use price trends to capture the best trade setups.
Essentially, it comes down to three key components...
A. Initial reversal/impulse waves should be traded lightly (if at all). They are the "potential price reversal setups" that are usually the most dangerous for traders (and often fairly short in length).
B. Looking for the second wave to form provides traders with the opportunity to catch the bigger Wave-3. This wave forms after the impulse (Wave-1) and a corrective wave (Wave-2), which must stay below any previous ultimate high or above any previous ultimate low.
C. Wave-3, and Wave-5 if applicable, are where traders can flex their muscles related to trade size using the techniques I present to try to capture the MEAT (Sweet Spot) of any trend.
Remember, after Wave-3, you must prepare for the potential end of a trend setup where volatility is likely to increase and risks become a bit more elevated.
I go over multiple techniques in this video.
Fibonacci techniques and Fibonacci Price Theory
Anchor Bars (breakaway bars)
Using Fibonacci Retracements to identify key support/resistance levels for trending
Stochastics
RSI
Wave formations (ZigZag)
and Others
This video is designed as an instructional video to help you incorporate usable techniques into your own trading style.
Hope you enjoy.


Dow Jones Yearly TemplateLast year in 2023, price was bouncing around the yearly candle's open and eventually blasted higher to form a bull expansion candle. The high to low of the entire year was 6,360 ticks and 20.24%. From the open of the year to the close, it was 4,566 ticks and a 13.77% gain.
This year in 2024, now that it is about half way through the yearly candle, is looking like a doji.
The range so far is small with only 2,978 ticks high to low. Only 8% from the low to high.
I have no clue what the rest of the year will bring. I am only looking at what it is doing in front of me.
There is really only three 2024 candles that can happen.
1. Buy low at the bottom of the yearly range under the teal blue 2024 Open price for a bullish run back up to the high for another bull expansion candle. (Bullish Expansion Candle)
2. Sell near the top of the range and hope the candle turns into a (bearish candle)
3. Play the ranges on both sides and the year goes sideways for a (small doji candle)
Usually after a big bullish expansion candle that we had in 2023, probabilities should say that we get more continuation or a bit of a rest as in a doji candle. I don't really see a bearish candle forming as of yet.

my options about us30My opinion about us30 in that zone you can see lt and it can be bearish zone hopefully you get profits

US30 (Looks like bullish confirmation)Technical Analysis
The price dropped and reached our weekly target of 38,050, as mentioned at the beginning of the week.
Now, the price will likely attempt a retest up to 38,190 and 38,400 before potentially dropping again. The bearish trend will be activated by stability below 38,050, targeting 37,820.
A bullish scenario will be triggered if the price breaks above 38,790, aiming for 39,050.
Pivot Line: 38,675
Resistance Levels: 38,790, 39,050, 39,350
Support Levels: 38,410, 38,020, 37,820
Today's expected movement range is between the support level at 37,820 and the resistance level at 38,400.
previous idea:

Big Movements to the upside.After a bearish landslide of a week, DJ will be looking to correct itself. Expect the bulls to make a massive upclimb. Especially after the PDH has been crushed. I keep it simple, block out the noice. Trade my zones and watch the movement explore. Peace traders $

BullishPrepare for higher highs.Dont mess this up.
HH and HL it's that simple, risk very little and keep the larger picture in mind.

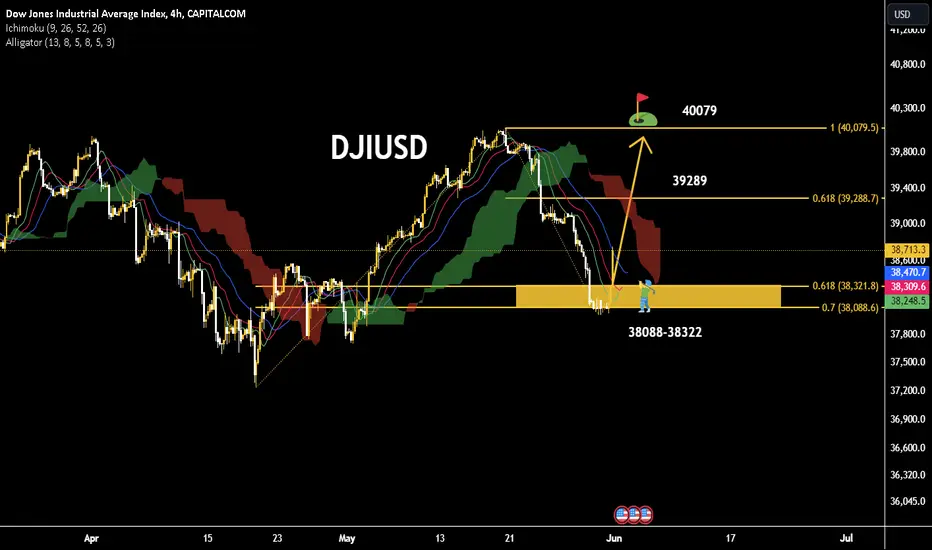
NEW IDEA FOR DOWJONES The increase in the Dow Jones index due to the increase in profits from the income of companies
By examining the trend in the four-hour time frame, the Dow Jones index, having an important support interval in the range of 38,322-38,088, can increase to the previous ceiling resistance in the range of 40,079, in the meantime, the 61.8% Fibo resistance will be seen at 39,289.


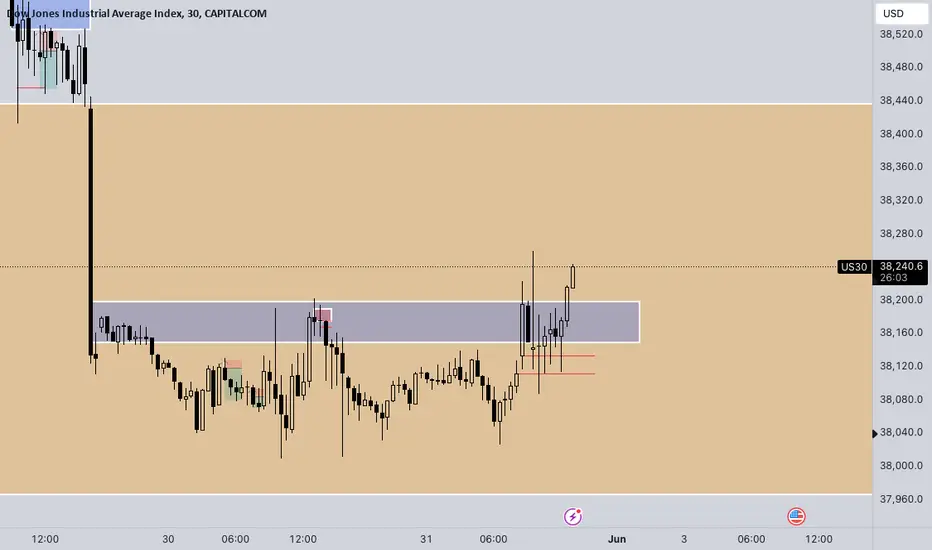
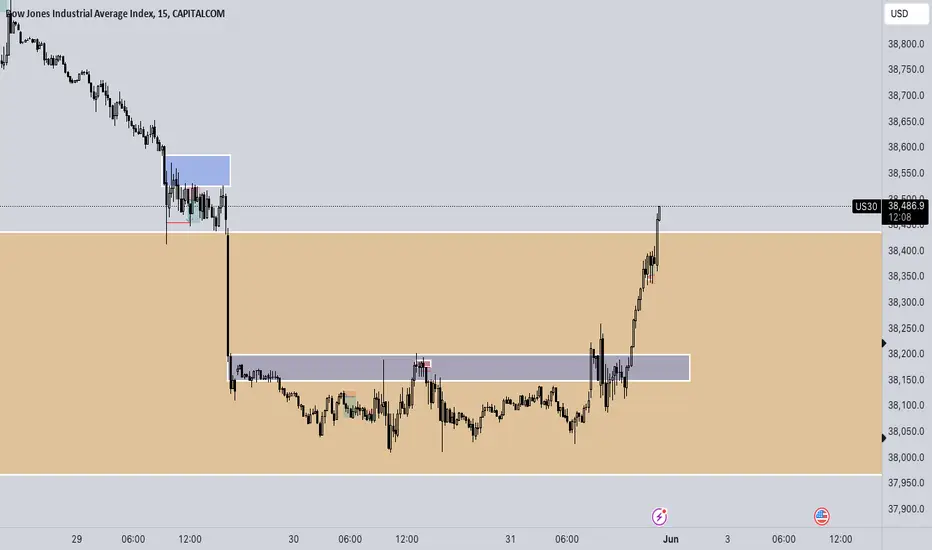
US 30 - Ranges overview (update) And just like that we end the month and take out the HTF buyside liquidity.
Just another end of the month...the weekend and a new week starting for a new month is awaiting us.
I hope you guys had a nice month and that your trading went alright.
As always whatever your bottom line for the month...it is simply a reflection of this month. Next month will be another month of new opportunities and trades. Don't forget RISK MANAGEMENT is your best friend..regardless of your profits.
Been a good month and some nice trending trading so let's see how we close the month...and what the market has in store for us traders next month.
Stay safe and never risk more than 1-5% of your capital per trade. The following analysis is merely a price action based analysis and does not constitute financial advice in any form.
Short Weekly Based on technical and price action analysis, the US 30 is expected to be short on a weekly timeframe, potentially dropping to 32,500.

DOW JONES (US30) LONGS NOT BAD IDEADuring the uncertainty and risk off environment, low GDP data didn't come unnoticed and big boys accumulated some equities after the huge Salesforce panic.
Today, with NASDAQ loosing almost 2% and 0.7% for SP500, DJ was accumulated, so I think we might see nice and strong reversal for the end of the week and month close.
Play safe and good luck!

US 30 - Ranges overview (update) The 30min imbalance held and we've taken the buyside liquidity.
Let's see how we move further from here.
As always don't chase the market..let it come to you and ACT UPON IT
Stay safe and never risk more than 1-5% of your capital per trade. The following analysis is merely a price action based analysis and does not constitute financial advice in any form.