CTK2019 trade ideas

BITCOIN GOLD SILVER OIL GAS COTTON LBLS Indicator AnalysisThe chart of D time frame is taken for all of these analysis
And
LongBuyLongSell Indicator is used for the analysis
you can take a look at it here
Follow the chart given above for each of its stand.
If you like Share Like Follow
you can also get more details below scroll down.
TVC:GOLD
TVC:USOIL
BITSTAMP:BTCUSD


Cotton Futures Short setup starting to showCorrective 1h ascending channel PA into top reversal zone will tell me there is a high probability for a reversal to occur soon.
We could also see a blow off top through the zone followed by a bearish engulfing 4h/daily which will then see a short move start.
Medium term hold trade.
Depending on the entry candle a 70c stop would see profit targets of 5.7R to TP area 1 and 11.2R to TP area 2 and 15.3R to TP area 3

Winter coming, put on some Cotton , would you ?1. price must stay along the pink bullish trend line
2. price must breakout of bearish channel (red trend line) and closed
above 66.04
3. price may hit 68 , then pull back though not necessarily (this is the 50% FIB level)
if it does, it presents a 2nd buy opportunity before going higher towards price at 71.61
(61.8 FIB level)


What is the fate of Cotton in 2020?This weekly chart provides a good understanding of
1. Gaps - price peak in May 2011 and has plunged more than 70% ! 8 years later, we are still in the dark tunnel
2. How resistance turns to support and vice versa
3. Price action - 2011 to 2012 - that was the waterfall plunge in the 1st short where it lost more than 70%. That means, for a shortist to miss understanding and act on this chart pattern, his potential opportunity costs is 70% loss.
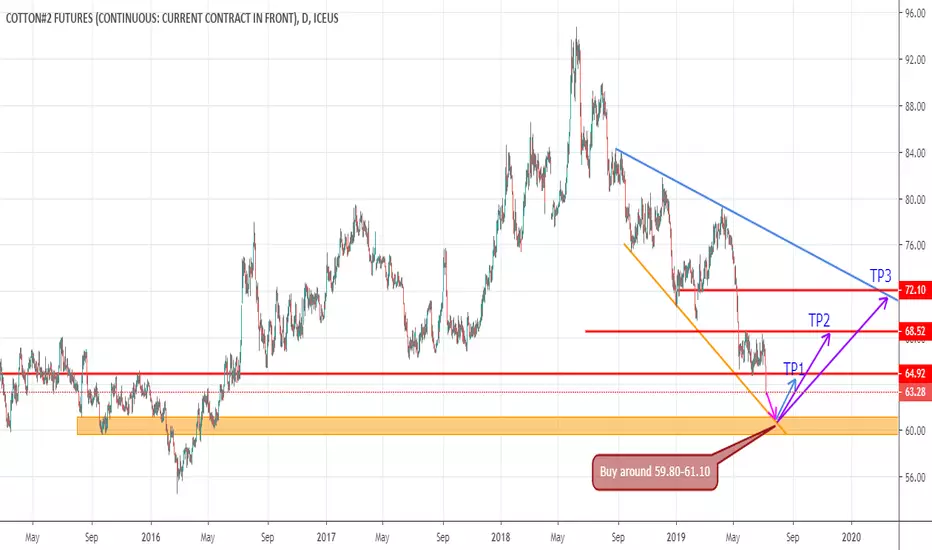
4. Current - Price action is now in a nice Cup & Handle pattern and there would be 2 buying opportunities. See day chart


Cotton Break ThroughLong Strategy: The price break through the resistance line. Buying point.
Stop Losing Point: The price break down the resistance.
#cotton #investment #stock #investing #future
www.yaonology.com

CTZ2019, Cotton Futures Dec 2019 - Breakout on Double BottomICEUS:CTZ2019
Bullish pulse and net breakout of the middle peak of the double bottom created on the December futures on cotton.
It has a very good potential in terms of risk reward and we know the volatility of commodities.
The general objective is always to try to reach at least 300% of the allocated on at least 4 trades out of 10 and never expose yourself too much, and then keep a very low risk on the positions so as to avoid heavy drawdowns.

Is it a good time to long cotton future?Wave analysis and technical indicators all point to a potential tradeable bounce of cotton future.


Cotton Long Hi there ! We post the next possible trading opinion to cotton CT1! which is possible after the terrible decline which took place this week after the escalated tensions of the trade war between U.S - China. As you see the diagram in daily timeframe the possible target price is at the level of the median BB. This bounce is also confirmed by the RSI. Also farmers price is by far the worst in 2 years.
Trade with safety.
Omen
(This is only a trading idea and not an investment advice ! )

Cotton rally?with commercials buying cotton I’m expecting atleast a “relief rally” to the 67-69 region
** Just an idea NOT a forecast

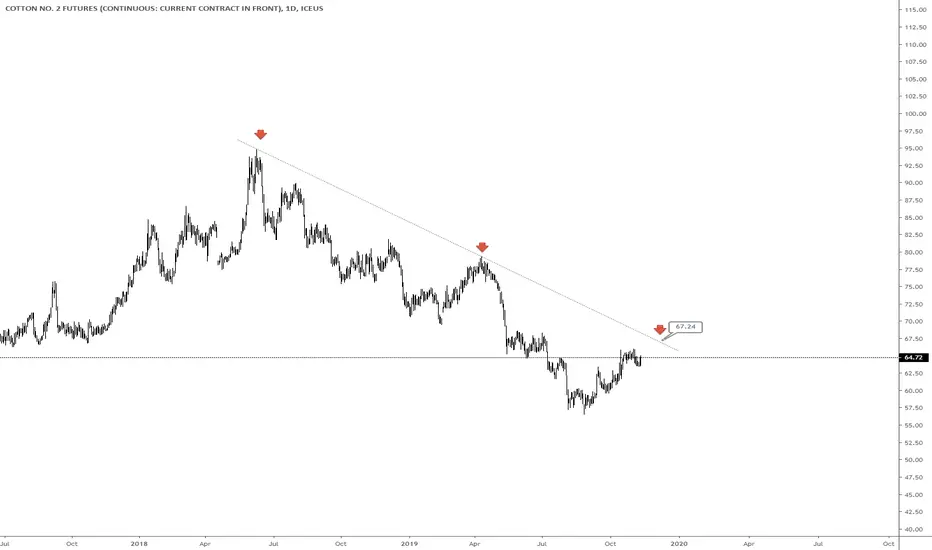
Cotton's COT on Maximum Levels as It Approaches 2009 SupportWe are nearing a price level, that served as the groundwork for the double bottom pattern and strong rally above. The price hasn't even come close anytime since. On top of that, August is seasonally good for cotton.
Yes, we might break. And yes, the downward moves are very impulsive (red arrows), whereas upward moves look somehow ill and weak. But I think, this level should at least become another stop in the downtrend if not reversal. Opening long and moving stop loss in the profit zone as soon as possible will likely ensure good profit chances.

BUY Cotton-USD Futures Target 74 July 24th
Cotton 2020 OCT future quote 65.74; target 74; 3-12 month bullish outlook duration.


CT1! Long (via. BAL)Cotton futures are currently caught in 2 separate bullish descending wedge patterns on positive divergences. There was one instance where the divergence did not play out, however this divergence was only visible on the RSI (August 2018) which is why we look for both. Coincidentally, assuming we have reached a bottom in the price of cotton futures, please appreciate the fact of how well the Fibonacci retracement levels overlap with the resistances above. Another interesting point to highlight is that if you take the measured move of both falling wedge patterns, and add that height to the potential breakout zone, then both distances happen to fall into the same area of resistance. That level of resistance at ~75.15 will be the final target for cotton futures over the duration of this year. For this trade, we will use BAL, a cotton ETN. A suggested stop would be at 36.28 (5% down) for a potential of 20% upside gain.

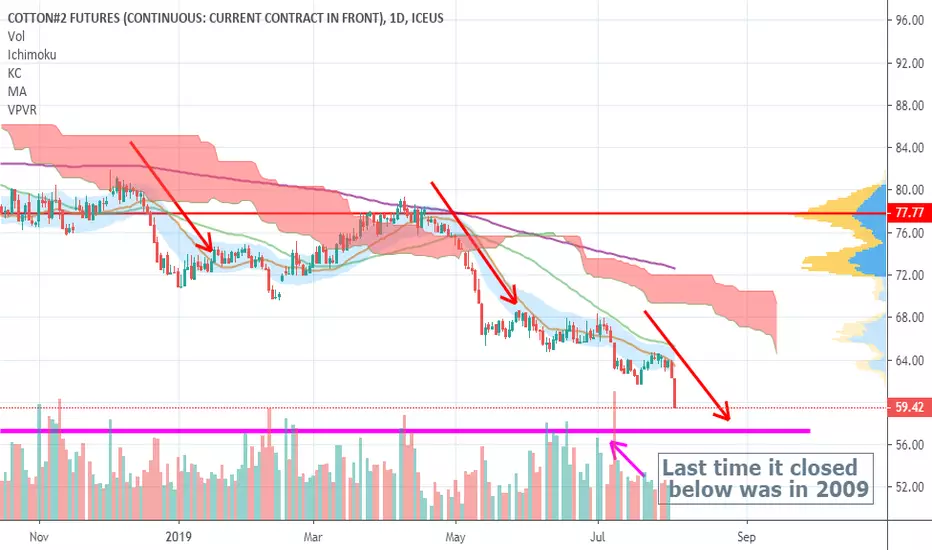
COTTON, Double Bearish Flag + Evening Star ConfirmationCotton has been on a bearish run since the end of April 19. The bears' domination is set to continue, as seen by the Double Bear Flag patterns recently established.
I'm currently short on the trade as I feel that the current Bear Flag action has come to an end. This is supported by prices breaching support levels and the formation of an Evening Star Pattern at the end of the flag. Additionally, recent bullish USD performance has exerted weaker buying pressure of commodities across the board, leading to stronger probability of a downtrend continuation.
