A Simplified Model for Bubbles. This post is to test a hypothesis we can break bubble moves down into five main stages and with these we can have a reasonable idea where we might be in that move.
Here I've marked up the phases on Cocoa and I'll also show some others that have similar phases.
Broadly understanding the phases of

$CCK2024 cocoa showing signs of exhaustionICEUS:CCK2024 Uhhh... Cocoa. The most it can rise to is $12,933.
I didn't read the article.
It is showing all signs of exhaustion. Volume is decreasing while the price is going parabolic. The oscillators are showing bearish divergence.
It is close to a pull back, if not out right crash to 800

SB ShortSB has sell signal based on COT report. Also seasonal trend is down. Weekly trend changed from up to down trend. The daily trend is in a down trend. Currently we see correction. My plan is to use this correction to open a shot position. Usually I risk 2% per trade, but in a Drawdown to reduce the em


COCOA : A CORRECTION IS DUE- The market has been trading above a bullish trendline since mid-March ; The mid-term trend was then bullish
- More recently, the increased appetite for the US Dollar has started to put pressure on a wide range of commodities, including Cocoa.
Since the impact on 11,212, the control of the market

ATH - COCOA FuturesCurrently Cocoa Futures trading in Strong bullish winter and will it rally further?


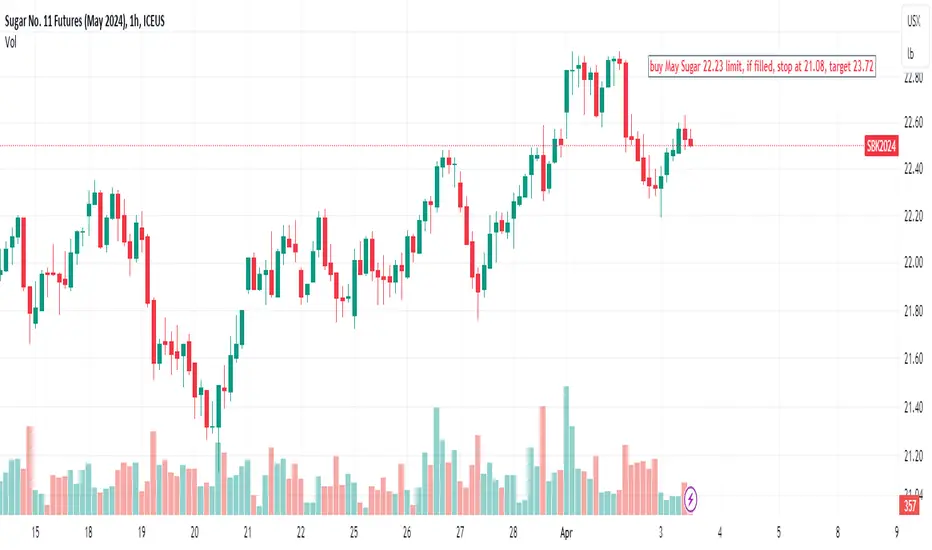
Buy May Sugar 22.23 limit, if filled, stop at 21.08, target 23.7Based on AI technical analysis, buy May Sugar 22.23 limit, if filled, stop at 21.08, target 23.72
[CC] Cocoa PullBack Incoming ?After a very large and strong bull momentum, it's time for me to start a short position to look for a pullback of at least 50% Fibonacci level.
Great Trade !

Coffee YearlyIn case you are wondering...
#Coffee STILL on deck for a MONSTER move on its yearly chart!
#starbucks #timhortons #inflation #commodities

See all ideas
A representation of what an asset is worth today and what the market thinks it will be worth in the future.
Trade directly on the supercharts through our supported, fully-verified and user-reviewed brokers.


Frequently Asked Questions
Buying or selling futures contracts depends on many factors: season, underlying commodity, your own trading strategy. So mostly it's up to you, but if you look for some certain calculations to take into account, you can study technical analysis for Cotton Futures. Today its technical rating is sell, but remember that market conditions change all the time, so it's always crucial to do your own research. See more of Cotton Futures technicals for a more comprehensive analysis.
The current price of Cotton Futures is 0.8090 USD — it has fallen 0.22% in the past 24 hours.