market respected the previous T_L session zone.The price respected the previous tokyo-london session zone and dropped as expected,
JPYUSD trade ideas

USDPYPossible USDJPY play during the CPI and FOMC news as im expecting a trend reversal which might not happen yet but should soon fall into place.

USDJPY: We've seen the peak for nowYen's weakness has been one of the biggest stories of the last two years, but we are set for a reversal in the near term.
Fundamentally, inflation and the economy are holding steady in Japan, and the carry trade looks very old.
In late April, the big reversal shook many carry traders out and opened the door to a near-term reversal.
This is a higher-risk trade for me than normal since the technical analysis is a mixed report.
The trend indicates more potential upside, while the candlesticks and chart patterns point to a reversal.
Momentum is neutral, encouraging an entry long, but the divergence demonstrates a sell.
Any more weak U.S. economic news could move this pair along quickly.
I think its current state is fragile.
I'll update this chart as it evolves.
OPEN SHORT
Trend: Bullish
Momentum: Neutral, Bearish Divergence
Japanese Candlestick Pattern: An Evening Star Reversal could be forming this week.
Chart Pattern: Possible Bearish Rising Wedge
Support and Resistance: 151.50, 148.50 are in play near-term.
U.S. ISM PMI and NFP could move the pair quickly this week.

USD/JPY LongContext:
• W and M showing (yet to be confirmed) rejections: Neutral with bullish touch
• Respecting Daily FVGs
• 2h big bullish FVG, 4h close above equal Highs
Idea:
• Entry in area between 156.600 - 156.15 with LTF reversal (e.q. 1h)
Scenario:
• Entry area should be approached without bearish FVGs
• 4h close below 156.49 (Equal Highs): Caution!
Scenario terminated:
• 4h Retracement below 156.15: Trade is off
Stop:
• Determined by your entry setup
Please feel free to comment with other ideas or questions.

Market Crash - The Death of the Japanese YenI've been doing some analysis on the Yen this year, because I think it's important. It's essentially my leading candidate for this "black swan" I'm predicting. It doesn't have to be the end of the world, but at some point there will be a catalyst for a new bear market and I think this may be it. There might not be another catalyst for another 5 years and we just keep ripping to new ATH year after year, or maybe there's one in 5 hours. Who knows. I think the Yen is most likely what will start things off, but we'll see. We have potential bank failures, Russia vs. NATO, Israel vs Iran, China vs Taiwan, and many other things that could happen.
Anyway, I'll do more ideas on this, but here's a weekly chart going back to the major top in 1986/1987. In 2014, this downtrend was finally broken, which led to the run up we are still seeing today. It held on a retest in 2020 with a massive volume spike as well. Also remember that in the case of this chart, an upside breakout is bad for the Yen, it's the opposite of what you may think intuitively.
The Yen had not hit 160 since 1990 and once it got there this year, Japan intervened twice to prevent it from going any further. That held it off for all of 2 months, it's already back to where it started. Which means, if treasury yields keep spiking, the Yen will get worse and worse until total collapse, BoJ can't save it forever. Treasury yields must fall or else equities are doomed.

USDJPY Sell oppotunity 166.96USDJPY already rejected from resistance area and ready for the retest 154.99 level. if unfortunately broke current support open buy order with 157.81 level target

An important week ahead for USDJPYThe USDJPY has experienced bearish pressure due to recent interventions by the Bank of Japan (BoJ), which has been purchasing Yen to stabilise its currency. According to Bloomberg, the BoJ has spent over $62 billion in the past month on these interventions.
Despite significant USD strength over the JPY driven by the interest rate differential, the chart shows prices dipping below the 155 level. This suggests that the BoJ's efforts have had a noticeable impact on the exchange rate.
It's crucial to consider that the BoJ may continue its intervention strategy, potentially leading to further corrections in USDJPY. Therefore, effective risk management is essential, including taking partial profits to safeguard against volatility.
My entry on USDJPY:
I am in a buy trade from 155.700. I plan on monitoring Monday and Tuesdays price action to potentially add to my positions ahead of Wednesdays numbers.
The following is news and data we need to keep an eye out for over the coming week:
Core CPI m/m, CPI m/m, CPI y/y
Federal Funds Rate
FOMC Economic Projections
FOMC Statement
FOMC Press Conference
Core PPI m/m
PPI m/m
Unemployment Claims
Prelim UoM Consumer Sentiment
Good luck guys!

Usdjpy longUsdjpy trend continues to buy side momentum
1:2 RR Overall trend buy breakout happened
Strict SL

USD.JPYWe have not observed any notable movement from this currency pair since the market opened. The price is currently within a specific range based on the parameters we indicated in the chart. If the 158.20 region is disrupted, the price may rise somewhat, perhaps to 160.00. Conversely, we may anticipate a decline in the dollar's value relative to the yen due to the sellers' pressure, which initially will be limited to a price range of 155.00 dollars. You might think about entering the sell trade within the region of 158.20; if this range of prices is not broken, there will be a significant selling opportunity.

Im waitingI am waiting for the price to reach this area and take a sell position. Currently, the trend is completely upward and any position in the daily time is illogical because of buying.

USDJPY Upside downtrendline breakout At 156.987. 10.06.2024Upside downtrend line breakout in USDJPY at 156.987.
If breakout holds:
Target 1: 157.270.
Target 2: 157.728 if 157.270 is broken.
If breakout fails:
Target 1: 156.786.
Target 2: 156.529 if 156.786 is broken.
Apply Risk Management
Risk Warning: Trading in CFDs is highly speculative and carries a high level of risk. It is possible to lose all of your invested capital. These products may not be suitable for everyone, and you should ensure that you fully understand the risks taking into consideration your investment objectives, level of experience, personal circumstances as well as personal resources. Speculate only with funds that you can afford to lose. Seek independent advice if necessary. Please refer to our Risk Disclosure.
BDSwiss is a trading name of BDS Markets and BDS Ltd.
BDS Markets is a company incorporated under the laws of the Republic of Mauritius and is authorized and regulated by the Financial Services Commission of Mauritius ( FSC ) under license number C116016172, address: 6th Floor, Tower 1, Nexteracom Building 72201 Ebene.
BDS Ltd is authorized and regulated by the Financial Services Authority Seychelles (FSA) under license number SD047, address: Suite 3, Global Village, Jivan’s Complex, Mont Fleuri, Mahe, Seychelles. Payment transactions are managed by BDS Markets (Registration number: 143350)
Disclaimer

USD JPY PRICE - STILL HAS TO CLEAR LIQUIDITY AT RESISTANCE ZONE USD JPY PRICE - here we can see that price forming a up trend line, price will take a support at 0.5 fib level make a long entry to resistance zone as shown, follow for more live updates...

USDJPY sideway waits NONFARM to break narrow marginThe Japanese yen was flat on Friday after the Japanese finance ministry announced Japan's foreign exchange reserves.
Japan's Ministry of Finance announced that he will take action on excessive JPY exchange rate volatility when necessary and will evaluate the effectiveness of the intervention. He emphasized the importance of maintaining market confidence in the JPY while also mentioning that there is no limit to the resources for the foreign exchange intervention fund.
The dollar is struggling after weak US employment data raises hopes that the FED will lower interest rates twice in 2024. Economists predict a rate cut in September in addition to the possibility of another cut. The possibility of the FED lowering interest rates in September.
In the h4 time frame, there have been signs of a bearish reversal in the USDJPY pair. The 34 EMA has crossed down to the 89 EMA and the recently created highs are getting lower. Overall, the pair is still stuck in a narrowing price band and is waiting for Nonfarm today to break out of the band.
Pay attention to important support and resistance zones:
Support: 156,400-153,600
Resistance: 154,500-157,700

Potential bullish rise?USD/JPY is falling towards the pivot which has been identified as an overlap support and could bounce to the 1st resistance.
Pivot: 156.38
1st Support: 155.33
1st Resistance: 157.95
Risk Warning:
Trading Forex and CFDs carries a high level of risk to your capital and you should only trade with money you can afford to lose. Trading Forex and CFDs may not be suitable for all investors, so please ensure that you fully understand the risks involved and seek independent advice if necessary.
Disclaimer:
The above opinions given constitute general market commentary, and do not constitute the opinion or advice of IC Markets or any form of personal or investment advice.
Any opinions, news, research, analyses, prices, other information, or links to third-party sites contained on this website are provided on an "as-is" basis, are intended only to be informative, is not an advice nor a recommendation, nor research, or a record of our trading prices, or an offer of, or solicitation for a transaction in any financial instrument and thus should not be treated as such. The information provided does not involve any specific investment objectives, financial situation and needs of any specific person who may receive it. Please be aware, that past performance is not a reliable indicator of future performance and/or results. Past Performance or Forward-looking scenarios based upon the reasonable beliefs of the third-party provider are not a guarantee of future performance. Actual results may differ materially from those anticipated in forward-looking or past performance statements. IC Markets makes no representation or warranty and assumes no liability as to the accuracy or completeness of the information provided, nor any loss arising from any investment based on a recommendation, forecast or any information supplied by any third-party.

USD/JPY as BOJ rate decision approaches The US federal Reserve is not the only major central bank making an interest rate decision this week. So too, will the nonconformist Bank of Japan (BOJ).
In its April policy meeting, the BOJ highlighted upside risks to inflation and indicated readiness to adjust monetary policy, if necessary, although it expects to maintain its current policy for the time being.
The BOJ stated that if the outlook for economic activity and price rises materializes, interest rate hikes could be warranted. Key economic reports from Japan prior to this week's interest rate decision include:
Japan GDP Growth Rate (final)
Japan Economy Watchers Survey Outlook
Japan Producer Price Inflation
For the exact date and time of these major economic events, import the BlackBull Markets Economic Calendar to receive alerts directly in your email inbox.
From the daily chart, the USD/JPY perhaps appears slightly bullish. The pair has climbed above the Ichimoku Cloud, indicating strong buyer momentum.
On Tuesday last week, BOJ Deputy Governor Ryozo Himino expressed concerns about the negative impact of a weak yen on the economy. His comments suggest that the BOJ might be preparing for another intervention in the forex markets to support the yen, which would be negative for the USD/JPY pair.
The 14-day RSI has recently pulled back, avoiding overbought conditions.

A Traders’ Week Ahead Playbook – Managing political risk• Month and quarter-end flows to impact price action
• The US Presidential elections kick up a gear
• Managing risk around the French 1st round vote
• US Core PCE is the marquee data point of the week
• Australia's monthly CPI a potential kicker for the AUD
• Central bank meetings due this week
• Long MXN back in vogue
For the week ahead there is a fair bit for traders to prepare for and to manage, with event risk spanning economic data, politics, and central bank meetings. We also gear up for month- and quarter-end, so the usual opaque portfolio rebalancing flows impacting price action, as well as the aftermath of a monster options expiry (OPEX) and ETF rebalance on Friday.
I’ve never personally found any edge aligning trades to what I’m hearing for the needs of portfolio rebalancing flows. However, as the big portfolios rebalance (e.g. from pension funds) the flows can impact equity, FX and fixed income and produce moves that can’t readily be explained by the data and news flow – any factor that alters our trading environment needs to be considered.
The US election kicks into gear
On the political front, the US Presidential election kicks into gear with the first debate held between Biden and Trump (21:00 EST / 02:00 BST / 11:00 AEST) likely getting sizeable attention. Prediction markets currently have Trump ahead by 5ppt, which is partly a function of Trump’s superior polling in the six key battleground/swing states (Michigan, Wisconsin, Pennsylvania, Nevada, Arizona, and Georgia). While the debate may not stoke market volatility, it will be symbolic given it’s the earliest live debate since 1960, and Biden will be out to prove a point to the American voters. As the gloves come off it could get ugly on the podium, and we watch to see if the debate affects polling.
Managing exposures into the French first-round vote
For those trading the EUR, FRA40, and European equities more broadly, the first round of voting in the French election plays out on Sunday. This will have many assessing the risk of holding exposures into the weekend vote, with the very real prospect of gapping on the Monday open. We can take a stab at the outcome and base-case scenario the market is currently pricing based on the French-German 10y yield spread and current pricing in EU assets, and from that loosely devise a playbook for a potential market reaction upon learning who will go through to the second-round vote scheduled for 7 July.
Given recent polling, I’d argue the broad consensus is currently seeing two outcomes – either Le Pen’s RN party gaining a working majority and cohabiting with Macron as President or a hung parliament with the RN party the largest contribution. I’m not sure we get a massive market response if this remains the base case after the first vote. The big reaction comes with a better outcome for the left-wing NFP coalition, where they seem to have momentum with recent polls have shown greater support for the coalition - the greater sway the left has on fiscal policy the more negative the reaction in the EUR, FRA40 and broad EU assets.
EURUSD holds below 1.0700 but is finding some support below the figure. Should the France-German 10yr yield spread widen past 85 to 90bp this week (its currently at 80bp) then EURUSD could be headed towards the 16 April lows of 1.0601, with EURCHF rolling over and eyeing a move back down to 0.9500. ECB 1- & 3-year CPI expectations (due on Friday) could promote some EUR volatility, but it will be trumped by market participants positioning ahead of Sunday's vote.
US core PCE inflation a risk event
On the US data side, US core PCE inflation is on Friday and is the marquee event risk, with expectations the Fed’s inflation gauge prints +0.1% m/m, and +2.6% y/y. The last two US PCE inflation prints have come in above expectations, but historically the outcome of the data falls in line with consensus. That said, if we do get an upside surprise and a year-on-year pace at or above 2.8%, this outcome would likely impact be taken badly by equity markets and result in solid USD buying. We get relief in risky assets, USD selling, should we see the month-on-month pace come in at 0.00% m/m and certainly if we see a decline.
We also get US consumer confidence where the consensus sees a lower read at 100 (vs 102 in the prior read), a Q1 GDP revision, personal income, and spending. We also get 9 Fed speakers through the week, although I don’t see these being too much of a risk, and we need to hear speeches post-PCE inflation data.
USDJPY and USDCNH both get focus, where the upside moves in USDCNH seem to be spilling over into strength in other USD pairs – the PBoC should look to curb yuan weakness this week, but higher levels in the USDCNH cross-rate should see lend upside support for the USD.
On the data side, we see Japan's Tokyo CPI (due Friday) and China PMIs (on Sunday), where the latter offers some degree of gapping risk in Chinese markets and the China proxies (AUD, NZD, CLP) on Monday. The client’s focus is on a potential break of ¥160 (in USDJPY) and whether we start to hear more from the MoF on JPY intervention – Japan rates now only price 4bp of hikes for the July BoJ meeting, and the market is happy to hold JPY shorts despite the likelihood the BoJ drastically reduce the pace of JGB buying. The rate of change and slope of the trend in USDJPY is the bigger issue though.
Aussie CPI in play
AUD and AUS200 traders will be watching the May monthly CPI read, with the consensus eyeing a lift in headline CPI to 3.8% (from 3.6%). The notable focus will be on services inflation, which keeps the threat of an August hike on the table, so this monthly print will set expectations for the all-important Aus Q2 CPI (due 31 July), which could go some way in influencing if the RBA do consider a hike in August. We also hear from RBA members Kent (Wed 09:35 AEST) and Hauser (Thursday 20:00 AEST). Prefer AUD upside vs currencies where the central bank is cutting or holds an easing bias (EUR, GBP & CHF).
I also like AUDNZD from a central bank divergence play and would be adding to longs on a daily close above the 50-day MA (1.0883).
On the central bank front, we see meetings in Sweden (expected to leave rates at 3.75%), Mexico (unchanged at 11%), Turkey (unchanged at 50%) and Columbia (50bp cut to 11.25%).
The MXN is certainly looking perky, with a blend of short covering and aggressive longs emerging late last week – USDMXN eyes support at 18.0514 and should test this soon. Driving the MXN we’ve seen several more market-friendly appointments in the AMLO cabinet, but we’re also seeing carry trades working well as a strategy, and this week should refocus the market on MXNs compelling fundamental characteristics, with high real policy rates and improved forward rates offering excellent carry. Long MXNJPY is in beast mode at this point but comes with intervention risk.
With the moves seen in US equity on Friday, we start the week with the ASX200, HK50, and NKY225 all looking like they open on the back foot, with our opening call 0.2% lower a piece. I remain biased to trade a range in the ASX200 (7850 to 7650) and NKY225 of 39,340 to 37,860, with a small bias that we see lower levels of these ranges tested.
Good luck to all.

USD/JPY Daily AnalysisThe 160 price point proved to be too much for the buyers at the end of April this year. The end of last week closed 17 pips shy of the big number. Will we see a reversal like we did when price tested and rejected the 152 wick high?

USDJPY Swing Trade IdeaBased on previous price action and upcoming news on Monday, my swing trade Ideology is based on a bearish sentiment. The last time we were at this price action we seen an heavy rejection.
I plan on taking a swing trade until we find another trend direction. While taking scalps at minor S&R areas.

I hope this analysis and strategy can help youHello traders,
for this week , the price attempt to create a new historical peaks
ENTRY POINT : the price is under bullish trend at 158.253 , the last week the price stable in buy zone , for this week it continues trade in buy zone and will attempt to create a new historical peaks , if breaking the entry point for any reason by open candle 1D below 158.253 active sell zone
ACTIVE BUY ZONE :for this week , if the price stable at 158.253 active buy zone , the price will attempt to reach resistance point 160.196 and 161.816 , it will be the creations of new historical peaks
ACTIVE SELL ZONE : if the price breaking entry point at 158.253 for any reason active sell zone , the price by open candle 1D below entry point reach a155.592 and 154.273 , stable this level reach 151.727


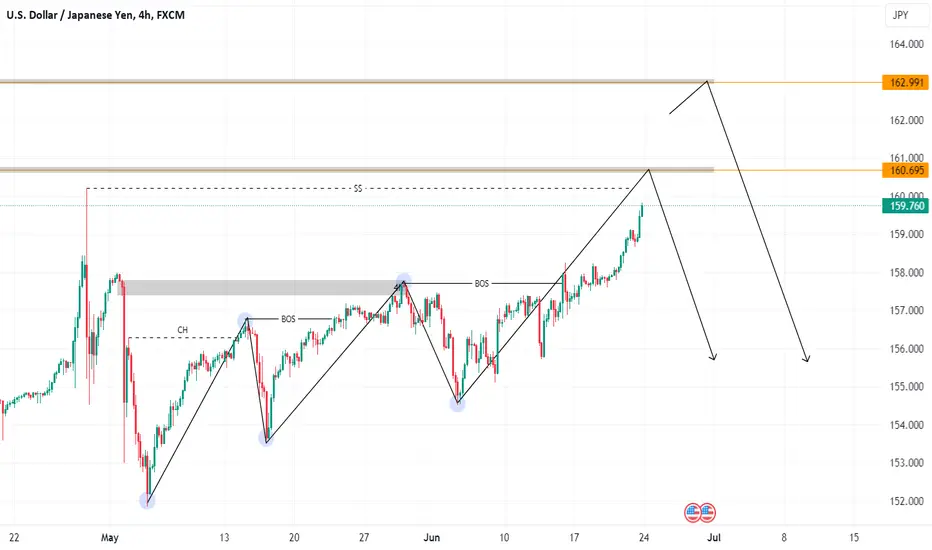
USDJPY idea-06/23USDJPY swing short idea
1. swing short point - 160.695
2. swing short point - 162.991
USDJPY BUY LONGFor seasoned traders looking at the USD/JPY pair, the presented 15-minute chart signals a potential long entry upon a bounce from the confluence of the rising trend line and key moving averages — an EMA and SMA — serving as dynamic support. The defined buy zone is demarcated in green, while the stop-loss threshold is designated in red beneath the trend line and moving averages, managing downside risk. Traders might target the upper boundary of the green rectangle for profit-taking, leveraging the bullish trend continuation narrative underscored by the supporting EMA/SMA framework. This setup caters to those employing a confluence-based approach, integrating price action, trend line support, and moving average indicators for entry confirmation and trade management.

Buy the nose Gather more data
Gather more data
Gather more data
Gather more data
Gather more data
Gather more data
Gather more data
Gather more data
Gather more data
Gather more data
Gather more data
Gather more data
