potential lina long marked blue zone is a bullish order block. long at the blue line or the end of the OB... and sl is end of H4 candle below
LINAUSDT.P trade ideas

LINA 30%+LINA 30%+
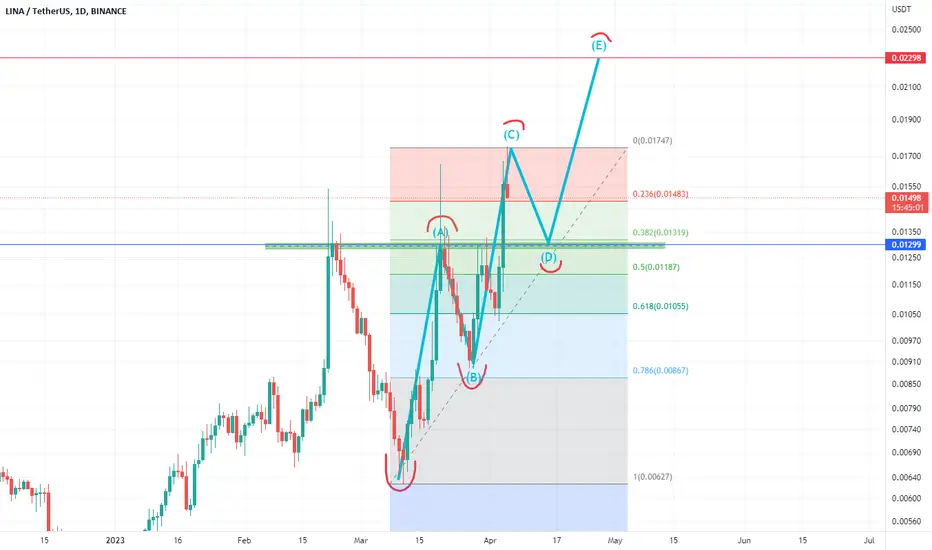
I expect the price to continue moving towards the area of 0.022
Best to buy 0.0158-0.0164 if the market allows it

Significance of the interval 0.017980-0.022345Hello?
Traders, welcome.
If you "Follow", you can always get new information quickly.
Please also click "Boost".
Have a good day.
** Analysis of the BTC chart publishes new ideas once a week.
** However, we publish new ideas when volatility occurs or when we show signs of diverging from our expectations.
** Excluding the above situation, BTC analysis is listed in daily updates.
-------------------------------------
(LINAUSDT chart)
(1W chart)
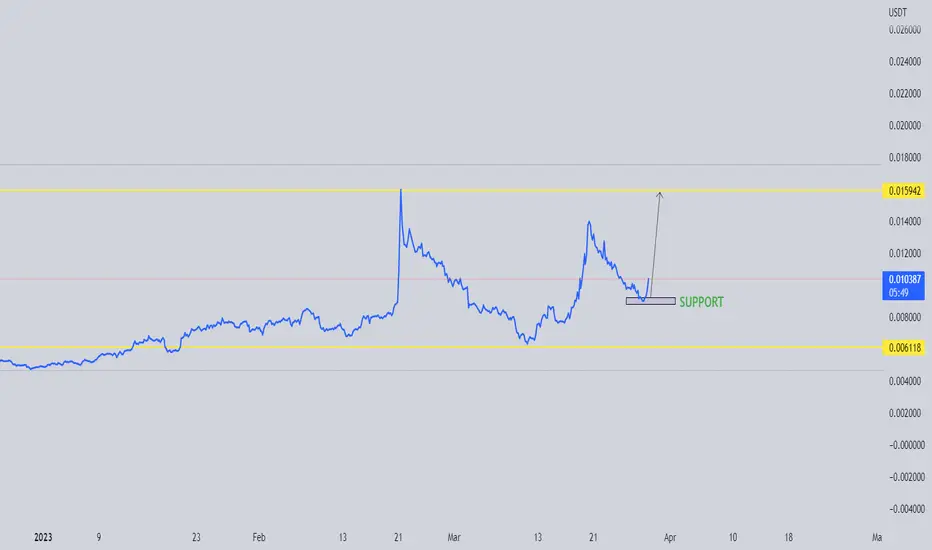
You can see that the Bollinger bands have contracted significantly.
Therefore, the question is whether the price can sustain an upward breakout above the upper Bollinger bands.
If not, you should check for support around 0.008080.
(1D chart)
It is important to see if the price can sustain the move above the 0.17980-0.022345 range.
If price holds above 0.022345, I would expect a move towards the 0.029620-0.031800 area.
-------------------------------------------------- -------------------------------------------
** All descriptions are for reference only and do not guarantee profit or loss in investment.
** Even if you know other people's know-how, it takes a considerable period of time to make it your own.
** This is a chart created with my know-how.
---------------------------------

can linear finance make another touch to the daily resistance?Broke out from a long-term downtrend... successfully rejected from the daily resistance twice.
RSi is above 50 and in the oversold zone...
I am interested to see if it can make another attempt to break the daily resistance.
the trade plan here:
wait for the breakout of the daily resistance, and rejection from the strong supply zone of 0.02$. SR flip of daily resistance at 0.0175. and then we long.

LINA / USDTDisclaimer: This chart and analysis are not meant to be, and do not constitute financial, investment, trading, or other types of advice or recommendations. Do your own due diligence before trading or investing in this.
Divergence in 4 Hr and Daily time frames
RSI over bought

$LINA 12month res test. 0.03 potential target #shitcoinalertVolume and resistant in all the right places. Decent upside if this runs through 18/19.
My insta page is with the developers. cheers.

Linear Finance is putting "something" into the future Lina priceLooking at the LINAUSDT chart, we can assume that MM is preparing for "something interesting."
Who has thoroughly analyzed the Linear Finance project? What is so interesting is about to happen that the Lina price is pressuring up as if a strong breakout is being prepared? Write pls about it in the comments.
In our opinion, if there are no dramatic changes in the mood of the crypto market, buying LINA around $0.0125 can be prudent.
The medium-term growth target is $0.0335.
Long-term growth target - $0.0865
_____________________
Did you like our analysis? Leave a comment, like, and follow to get more

LINA analyze on short / mid termIf yesterday's spike was a new local HH then a retrace to 0.013 it is expected and a good point to enter LONG. The "final" target should be 0.023
LINAUSDT(Linear Finance) Daily tf Range Updated till 05-04-23LINAUSDT(Linear Finance) Daily timeframe range. if it fails #0.017330 on this daily candle it will be 3rd time, which is not a good sign. unless you inject more volume into it which can lead it to #0.021930. failing here leads back to #0.012119 and below.


LINA : INCREASE VIEWLINA seems to show an interesting volume.
we will follow this coin to see if it's able to confirm from this support zone.
It will be only interesting if it shows a building increase in the coming time frame.
The increased view means only coins that could be interesting for confirmation.
Most coins are still not building long-term increased views.
TREND VIEW THAT SHOWS BREAKOUT 200% POSSIBLITY FOR LINALina shows a good possibility of breakout the coming time.
The high time frame expected target could be 200% range.
At this moment as the trend shows LINA showing an interesting trend pattern.
We will follow to see if this pattern will get confirmed as the trend shows.
There is no guarantee that the market will increase by 200%, but the possibility is high.
The crypto and hype news shows at this moment that the doge is interesting, but the TA study patterns show Lina is more interesting.
LINAUSDT 1HLINAUSDT 1H
It has broken the upper edge of the Keltner channel and its next resistance is at 0.0161 , EMAS pointed up means that LINA is following the EMAS despite the RSI with exhaustion of selling forces and the MM200 is at 0.01146 (powerful magnet)
SUPPORTS AND RESISTANCES IN 1H:
Brackets: 0.01651 / 0.017476
Resistances: 0.013523 / 0.12183
RSI: Exhaustion of Buying Forces
MACD: buyer
MM200: 0.011468
EMAS: pointing upwards

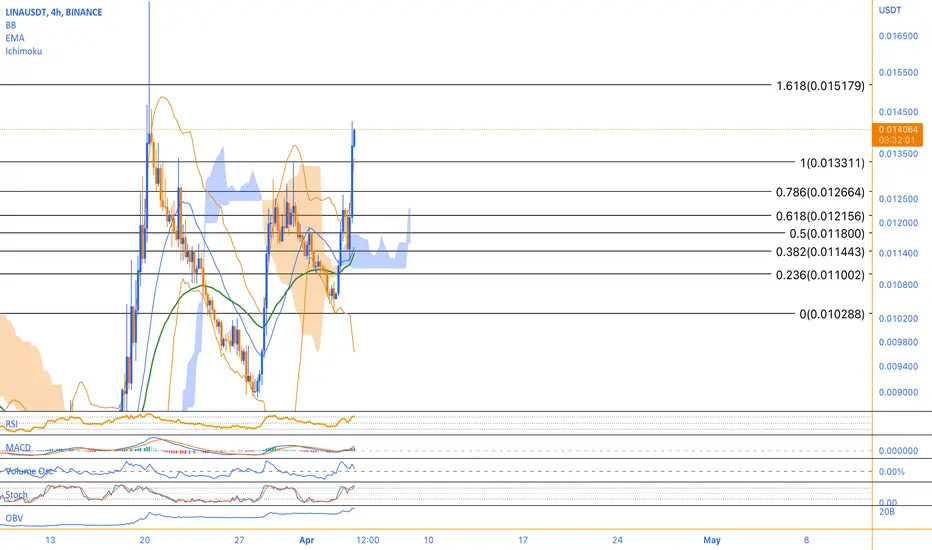
Short-Term Bullish Momentum with Potential for CorrectionLINA is currently priced at $0.013900, which is above the 0.5 Fibonacci level of 0.011800 and the hourly EMA 50 of 0.011387. This indicates that the coin has short-term bullish momentum. However, the RSI is at 72.41, which is above the overbought threshold of 70. This suggests that the coin may experience a correction soon, especially since it is trading near the upper Bollinger band at 0.013384.
On the 4-hour timeframe, LINA has three key Fibonacci levels to watch out for: the 0 Fibonacci level at 0.010288, the 0.5 Fibonacci level at 0.011800, and the 1 Fibonacci level at 0.013311. As of now, the coin is trading above all of these levels, indicating that it has bullish momentum in the short term.
However, it's important to keep an eye on the volume oscillator, which is currently at +14.40%. This suggests that trading volume is increasing, and could potentially sustain the bullish momentum. Meanwhile, the MACD is at 0.000460, which also suggests that LINA has short-term bullish momentum.
That being said, the Stochastic oscillator is at 92, indicating that the coin is overbought and may be due for a correction soon. If the coin starts to fall, there are two key support levels to watch out for: the 0.5 Fibonacci level at 0.011800 and the hourly EMA 50 at 0.011387. These levels could potentially provide some support for the price.
On the other hand, if the price continues to rise, there is a solid resistance level at the 1 Fibonacci level of 0.013311. If the coin can break above this level, it could potentially continue to rise even higher.
Overall, LINA has short-term bullish momentum, but traders and investors should keep an eye on the RSI, volume oscillator, and Stochastic oscillator for potential signs of a correction. Additionally, the 0.5 Fibonacci level and hourly EMA 50 could provide support if the price starts to fall, while the 1 Fibonacci level could act as a solid resistance level if the price continues to rise.
LINAUSDTDisclaimer
High Risk Investment
Trading cryptocurrencies and Forex carries a high level of risk, and may not be suitable for all investors. Before deciding to trade cryptocurrency you should carefully consider your investment objectives, level of experience, and risk appetite. The possibility exists that you could sustain a loss of some or all of your initial investment and therefore you should not invest money that you cannot afford to lose. You should be aware of all the risks associated with cryptocurrency and Forex trading, and seek advice from an independent financial advisor. Since Any opinions, news, research, analyses, prices, or other information contained on this website is provided as general market commentary, and does not constitute investment advice. The Bibres will not accept liability for any loss or damage, including without limitation to, any loss of profit, which may arise directly or indirectly from use of or reliance on such information. All opinions expressed are owned by the respective writer and should never be considered as advice in any form.
A qualified professional should be consulted before making any financial decisions.
-----------------------------------

LINA on The Way to .023Hello every one
LINA is forming a Bullish Pattern which is a Cup & Handle Pattern! The Pattern Hasn't Formed completely Yet, But It will Complete Eventually and That's When We Need a Break out For LINA. IF it Happens, we Can Expect a Bullish Movement as Much as The Measured Price movement To happen ( AB=CD ). If our Predictions Come True price reach to 0.023.
✅Access trading ideas, build strategies with drag and drop, backtest, and automate your trading for passive income with our Sponsor's platform Vestinda. check it out using the link in the Description.
_ _ _ _ _ _ _ _ _ _ _ _ _ _ _ _ _ _ _ _ _ _ _ _ _ _ _ _ _ _ _ _ _
🌍Thank you for seeing idea .
Have a nice day and Good luck.

lina getting ready for Massive Breakout testing Trendline In Htfs Incase Of breakout expecting Massive bullish moves In Midterm
Incase Of breakout expecting 300 to 320% bullish Move

LINA USDT PERP FUTURES, SHORTING, 20% GAIN PROBABILITYBroke down from strong support(Demand Zone) and broke down from all Moving Averages at 15min. time frame, with 1:2-4 risk reward ratio.

linausdtlina looks strong
would like to see deeper retest, but so far as a scalping idea you can try to long it.

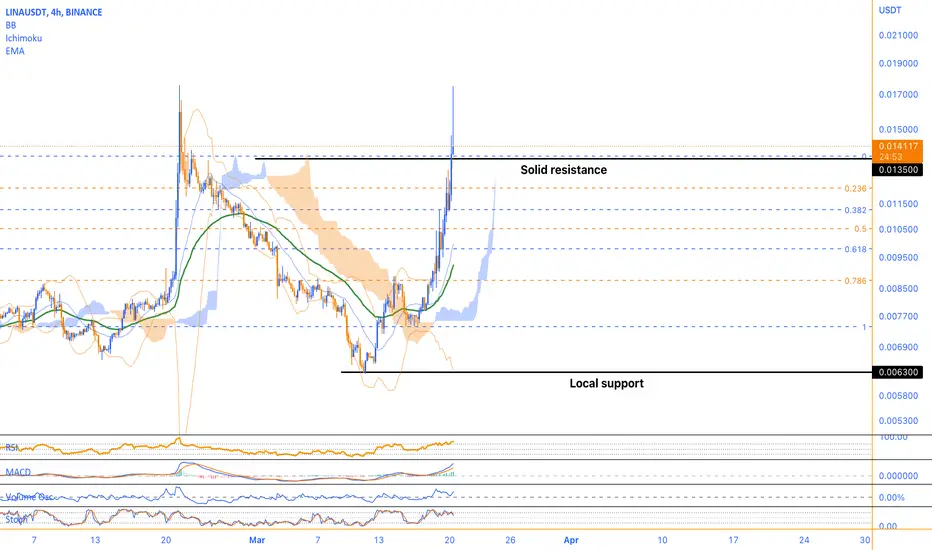
Bullish Signals Despite Overbought RSILINA is a cryptocurrency that has had a great gain today, currently sitting at a price of $0.014000. If we look at the technical indicators, there are a few things we can consider.
First up, the Relative Strength Index (RSI) is at 80, which means that the asset is overbought and may need to correct. However, the Moving Average Convergence Divergence (MACD) is at 0.0013, which is a bullish sign that the asset could be poised for growth.
The Stochastic Oscillators are also at 62.5, which is another good sign for LINA. However, we should also take note of the Volume Oscillator at 36%, which suggests that the trading volume is moderate.
Looking at the Fibonacci levels, there are three we should consider: 0.0074, 0.0081, and 0.0088. Currently, LINA is trading above all three levels, which is a bullish sign. However, we should also be aware that the current price is above the upper Bollinger Band at 0.0135, which suggests that the asset is overbought and may need to correct.
On the other hand, the middle Bollinger Band at 0.0099 is also an important level to keep in mind. LINA is currently trading above this level, which is a good sign for potential price growth. The lower Bollinger Band at 0.0063 could also serve as a support level if the asset experiences a correction.
Finally, the 4-hour EMA 50 at 0.0092 is yet another level to consider. The current price is above this level, which could be an indicator of a bullish trend.
So, what does all of this mean? Well, based on the technical indicators we've looked at, LINA seems to be a cryptocurrency that is in a good position for potential price growth. Of course, as with any investment decision, it's important to perform additional research and consider other factors before making a move. But for now, things are looking pretty positive for LINA.
Lina big Cup small Cup, nice pump popopopYes I have nothing to say, just that Lina could pump to 0.012 soon. I am long

LINA BUY SETUPHi, dear traders. how are you ? Today we have a viewpoint to BUY/LONG the LINA symbol.
For risk management, please don't forget stop loss and capital management
When we reach the first target, save some profit and then change the stop to entry
Comment if you have any questions
Thank You

Linear Finance (LINA) forming a bullish BAT for upto 135% rallyHi dear friends , hope you are well and welcome to the new trade setup of Linear Finance (LINA) with US Dollar pair.
On a daily time frame, LINA is about to form a bullish BAT move for another price reversal.
Note: Above idea is for educational purpose only. It is advised to diversify and strictly follow the stop loss, and don't get stuck with trade
