LINKUSDT short idea in weekly mapHello Dears
The weekly trend is falling. The price has touched the important weekly trend line. Also, I saw divergence.
JUST ENTRY SPOT !
LINKBEARUSDT trade ideas

LINK - Short ( 26 Sep - 01 Oct)Good luck to everyone! This analysis is for educational purposes only and does not constitute financial advice. Conduct your own analysis before making trading decisions.

RANGEis this the longest range ever or what :D
rsi on HTF starts to look pretty nice for some long setups
Weekly Imbalance Filling for CHAINLINK 🚀💼In the ever-evolving world of cryptocurrency trading, recognizing unique opportunities is essential for success. One such opportunity that often goes underappreciated is the concept of weekly imbalance filling. In this post, we'll dive into what weekly imbalance filling means and why it's crucial, especially for assets like LINK, which hold significant growth potential.
Understanding Weekly Imbalance Filling: A Hidden Gem
Weekly imbalance filling refers to the process of fulfilling previously unmet market orders, typically those accumulated during weekly price gaps.
These gaps represent levels where market participants have unexecuted orders, creating a potential catalyst for price movements.
Why It Matters: The LINK Perspective
Chainlink (LINK), known for its innovative decentralized oracle network, is an asset with substantial growth potential.
Recognizing the power of weekly imbalance filling can be especially beneficial for LINK traders and investors.
The Potential Benefits: LINK's Growth Catalyst
Filling weekly imbalances can act as a strong catalyst for LINK's price appreciation.
By addressing these gaps, the price often experiences upward momentum as market orders are executed.
How to Leverage This Opportunity: A Game Plan
Identify Imbalances: Use technical analysis to locate weekly price gaps or imbalances on LINK's chart.
Monitor Closely: Keep a close watch on these levels, as they may serve as key turning points for LINK's price.
Trading Strategy: Develop a well-thought-out trading strategy that incorporates weekly imbalance filling as part of your decision-making process.
Risk Management: Always employ sound risk management practices to protect your capital.
Conclusion: Seizing the LINK Opportunity
In the dynamic world of cryptocurrency trading, it's crucial to stay vigilant and explore all potential avenues for profitable opportunities. Weekly imbalance filling represents one such avenue, and when applied strategically, it can serve as a powerful catalyst for LINK's growth.
Chainlink's unique position in the blockchain ecosystem and its ongoing development make it a prime candidate for benefiting from this phenomenon. By understanding and harnessing the potential of weekly imbalance filling, traders and investors can position themselves for success in the LINK market.
Remember, while this strategy holds significant potential, it's important to combine it with comprehensive analysis and disciplined risk management for a well-rounded approach to trading LINK. 🚀🔗🚀
❗See related ideas below❗
Like, share, and leave your thoughts in the comments! Your engagement fuels our crypto discussions. 💚📈💚

#LINKUSDT #LQR #TOBTC #LaqiraProtocolThe price has been corrected to the source of its own downward wave. After confirming and matching with Bitcoin levels, you can open positions from certain Level . This analysis is not an offer to buy or sell.

LINK RANGE BOUND - BUT FOR HOW LONG?Have been monitoring link in this range for some months...the weekly range is clear as day.
WEEKLY
weekly price action is showing that the upper key area (red) is being rinsed out... everytime a wick moves into this area it is sold off. Now looking at the first three times price has entered, it has produced an engulfing candle, showing strong reversal, to lower end of the range, which is around 35% move... a move to the upside of the range is around 55%. So do the math. We have also been chopping in this range and managed to push out to the downside and tag the previous high (purple) which never got tested on the way up.
The Green line - 'trendmaster / E9 sTM' flashed green on the past impulse leg up, as an entry rule when this switches we enter on a retracement, we have retraced all the way down to lower end of range and hovering above the level. E9 Overwatch is neutral.
DAILY
So on the daily i am currently monitoring this orange fibb / accumulation zone, we can see the bottom of the weekly range (whiite line), There are buy signals (light green candles) appearing from the Overwatch MFI. Just by looking at the price action i can see on a lower timeframe there is some accumulation patterns happening. his is in and around the area for previous impulse POC area. Something else to take note of is the recent Bearish engulfing candles do make me pause for concern.
Moving forward would like to see a confirmation of a nice Bullish engulfing candle on the daily chart, when this happens i will update this and we can monitor moving forwards.

LINK Bulls Unleashed: Charting the Path to 7,300 in StyleAs we mentioned last time, LINK has found support around 6,000, and now a potential return to prices around 7,300 is possible if BTC continues its bull run. We could then target the next zone around 9,300.
Click Boost for more

CHAINLINK struggling to break the resistanceLINKUSDT is currently having dificulties breaking a major resistance at $7.50. The US dollar is on the rise after the FED hold and assets like cryptos are struggling to push to the upside in this risk-off context. A clear and strong rejection of this key resistance could created the momentum needed to go lower to my targets and even lower...

Link/usdt to fill in the volume between 8.11-12.95Super simple/quick look at link usdt/chart and we can see a lack of volume between 8.11-12.95 throughout the history of this coin
whether the market takes it there or the market maker moves price there it will inevitably be filled just as the other price levels have been with buying/selling volume
This isnt necessarily a trade setup but looking at it on HTF it makes sense to be looking for areas to buy and sell on this pair
Wouldn't be shorting this recent pump here but looking for longs
its likely this runs to 12$ before the end of the year (sometime in the next 3 months)

Bull market around the cornerAfter a fair bit of pain for over 1 year now, most cryptos have been beaten into the dust. ChainLink being no exception, it has been trading in a tight corridor for a really long time now.
Looking to buy into a spike pushing this back into an uptrend since it seems to have found quite a bit of demand in the green channel.

LINK Short2 Possible scenario for short position. Still go on a short. Will change my bias when the price breaks 9.69X area.

LINKUSDTLINKUSDT is in strong bullish trend.
As the market is consistently printing new HHs and HLs.
currently the market is retracing a bit after last HH, which is also the 50% fib retracement level and the previous broken resistance might be turning as a support. if the market successfully sustain this bullish confluence the next leg high could be 7.5.

LINK ShortPrice might move sideways, If Link continue to respect this supply zone, then wait for a break of structure then enter on a retest.

LINK USDT SHORTHere the candles are forming the rising wedge pattern and the price would go down to the first ressistance in 6.9$

LINK - new bull run started?Hello, everyone!
Today a lot of traders making analysis on BINANCE:LINKUSDT because it has suddenly pumped against the entire market. Could this coin be already bottomed or new lows are incoming?
Looking at the price structure since ATH we have the clear EW counting. Global ABC correction is represented here as a classical zigzag. Wave C in this case should has 5 waves. Minimal Awesome Oscillator value corresponds to wave 3 and current flat is the annoying wave 4.
Technically bear market could be finished because we have already seen the bullish divergence and lower low, but Bitcoin in my opinion should dump and I cannot understand how altcoins can pump against it. That's why I expect another one lower low in the wave 5.
📢Smash like button and follow us to never miss an update

LINK could drop soon very soonWe have a bearish CH and two cleared zones on the chart. After clearing the buy orders, the link is returning to an area where there are many sell orders. By dealing with this area, I expect a good rejection from LINK.
For risk management, please don't forget stop loss and capital management
When we reach the first target, save some profit and then change the stop to entry
Comment if you have any questions
Thank You

LINK has a bullish signal!
🎗#LINK/USDT 🎗
LONG
Leverage: (10.0X)
Entry Targets:
1) 7.21
2) 7.15
Take Profit Targets:
1) 7.31
2) 7.42
3) 7.53
4) 7.60
5) 7.71
6) 7.80
7) 7.81
8) 8.03
Stop Targets:
1) 6.40
🟡Chart is speaking it self!
_ _ _ _ _ _ _ _ _ _ _ _ _ _ _ _ _ _ _ _ _ _ _ _ _ _ _ _ _ _ _ _ _
Thank you for seeing idea .
Have a nice day and Good luck
🔴This is only an idea and not a financial advise ( NFA )🔴


LINKUSDT weakening of 4h timeframeLINK tested the major support area for days and causing price to pump.
RSI divergence shows weakening of the rally, if LTF (lower time frame) shows CHoCH (change of character) and creates HL (higher low), I can expect retest of immediate support.

Link for sellHi guys
As you can see, the trend line is broken in the daily time and after the pullback, the CH floor is also broken
I placed a FIBO on the downtrend and marked the 0.66-0.78 zone for selling.
Good luck

#LINKUSDT will give last chance for buyingLINKUSDT will give last chance for buying.. It will may got ot target . But not in days, may be in months (3,4 ) month..

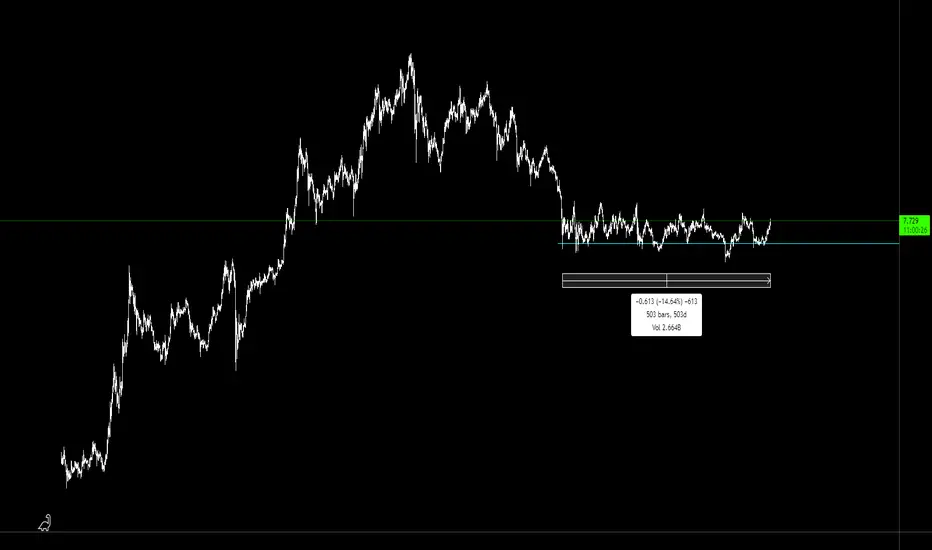
LINK: new HTF analysisMy previous TA on LINK was correct on daily timeframe but the spring hat was created wasn't enough to break the range because it was too small for a weekly/monthly BoS. As a consequence you can see LINK being in the same range after 500 days. Here you can see my new updated TA.
So basically it keep being time to accumulate either link in DCA or to have a good supply of stablecoin ready to buy LINK when the range will break downward in order to create a spring which will push the price over the range and toward new highs (when bull market will be fully among us).
Good luck

