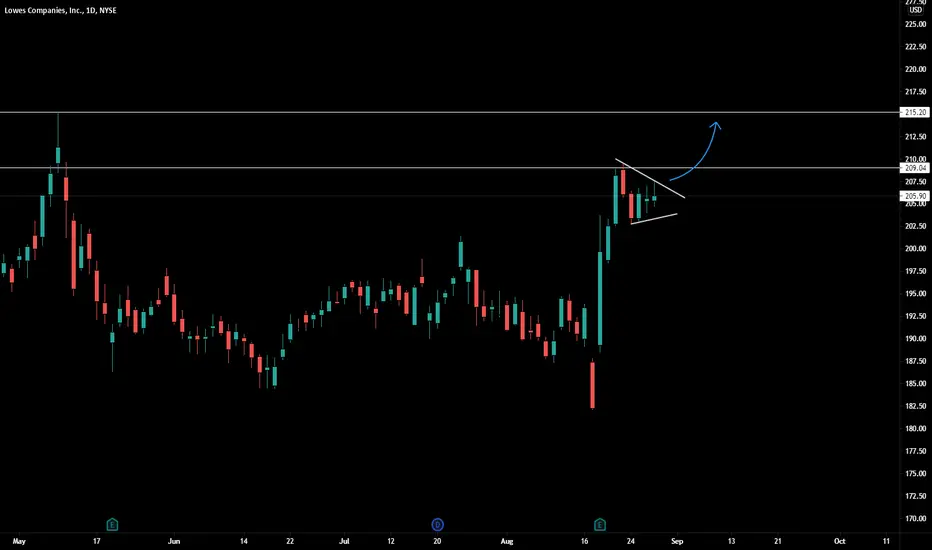
LOW flaggingNice symmetrical triangle / flag forming after a crazy few days last week.
It has very strong resistance above ( 209 and 215.20)
However if we break the triangle, we might see a strong push towards ATH
0JVQ trade ideas
<TradeVSA> Pullback in Weekly chart. Breakout Soon?Sign of Strength in the chart:
1. Reaccumulation with Sign of Strength in daily chart
2. Green Pentagon High Volume
3. Strong uptrend with pullback in weekly chart
Disclaimer
This information only serves as reference information and does not constitute a buy or sell call. Conduct your own research and assessment before deciding to buy or sell any stock

$LOW Lowes Companies Trade Setup
Hopefully you find the chart helpful in terms of Supports & Resistance etc.
we refrain from adding commentary on the chart as that is reserved for our members and we are very conscious of not giving financial or trading advice.
Thank you for taking time to consult our chart and we would really appreciate a like, follow or comment.

Lumber as Supply or Speculation 2Lumber prices are likely responding to increased supply. We can tell because not only is Lowe's (LOW) moving lower, but also Whirlpool (WHR) is moving lower in the same dynamic. Both of these stocks are components of State Street's Homebuilder ETF (XHB) and all of them are related to the price movement in Lumber futures (LBS). Since Whirlpool's appliances aren't made of wood, it is safe to say that newly added supply (of both appliances and new homes) is being generated, driving profit margins lower.

$LOW with a Bullish outlook following its earnings #Stocks The PEAD projected a Bullish outlook for $LOW after a Negative over reaction following its earnings release placing the stock in drift C
If you would like to see the Drift for another stock please message us. Also click on the Like Button if this was useful and follow us or join us.

IRON TARIHi guys,
this IV brings me to reverse the condor again.
3 weeks and 3% strikes give a range to be ITM with the 2 sold options between 192.5 and 205.
The odds to end ITM are only 24%, so I revrese the condor to have a nice 76% probability of profit, RR almost 1
Subscribe for free to trade with Tari Condor.
Enjoy your wallet!
Tari,


LOW - RiskyThis is a risky trade since we are still inside the channel,
But i am using this support area as a possible reversal .

lowe--> catch me if u canLowe recently showed a breakout from bull flag pattern. It is ready to move up. Also its brothers like home depot is moving up. Sector is hot
hope you are enjoying my analysis, ideas here are for entertainment and education these are not trading advice

LOW - BULLISH CANAL / TARGET TO THE MOONAaron’s Furniture ( AAN )
Big Lots (BIG)
Croc’s ( CROX )
Lowe’s (LOW)
REASON: Retail - especially those brands less equipped to adopt e-commerce - was hit hard by the pandemic. Not only were people not visiting shopping malls or buying work clothes, but fashion as a whole was reduced to sweatpants and leisure clothes, taking many fashion retailers on a prolonged dip.
With retail, investors should be looking for brands that continue to support trends that started in the pandemic, such as retirement names while people continue to work from home - some permanently - as well as retailers that offer discounted retail experiences or flexible.

IRON TARIHi guys!
This iron condor is 4weeks 10% strike.
Odd pretty nice, the premium is not that much, but sice we can cut the loss the RR is on our side!
Enjoy your wallet!
Tari.

Is Lowes Signaling An Overall Market Decline?Lowe's triggered my early-warning price reversal algorithm. The full accuracy when this occurs is detailed in the article at my website below. The RSI algorithm determines overbought and oversold levels. The algorithm signaled a SELL on April 6, 2021. Equities nearly always obey the signal and move down, but sometimes it may continue to move up first. This is interesting if the signal is accurate. We are heading into the summer months which would ultimately be profitable for the company. The stock could be in for another short-lived cool off which is most likely the case here. Most of my algorithms may point to a reversal but that reversal ends up reversing usually within 50 trading bars. While the current signal ultimately has the stock dropping, it could gain slightly first. Once the drop has occurred, there is no doubt Lowe's will be primed to retrace this drop.
I have placed two red boxes and two green boxes on the chart. The larger red box depicts all of the historical movement, from a percentage standpoint, that this stock has moved on the Daily chart after a SELL signal occurred. Therefore, this box represents 100% of previous movement upward before the stock finally moved downward. The smaller red box represents 50% of all historical movement upward, before the stock moved downward. The smaller box is more of a precise target for the potential top in this instance.
The green boxes represent the same thing. In this instance, the smaller green box would be my projected target for the final bottom.
The black dotted arrow represents median historical movement. Medians are a good metric, but they are just one of many I use when forecasting future movement.
As always, the stock could decline the very next bar after the signal without looking back (therefore the red boxes would not come into play) or the stock may never decline (and the green boxes may never come into play).
All statistics and the full analysis are available for free as always at the site below.

$LOW Lowes Companies Perfect Breakout $200 target 🎯
Lowes has broken out of the range and has performed a Back-Test before rallying today.
Potential long entry with a $200 price target

LowInverted hammer candlestick or shooting star waiting for (gap down) bearish engulfing candle to close below 8 Ema line.


Short it LowesConsolidation since Sept. Gravestone doji candlestick showing .Tried to break out today and got rejected; slumping home sales numbers that were released didn't help.
Targets are fib red lines

Lowes - Further Lows?Watching for the last support on Lowes @ 150, if breaks and continue bear momentum this has a chance to fall in line with pre covid levels and fall past all the overbought land on RSI!

$LOW with a bullish outlook following its earnings #Stocks The PEAD projected a slight bullish outlook for $LOW after a positive over reaction following its earnings release placing the stock in Drift B
If you would like to see the Drift for another stock please message us. Also click on the Like Button if this was useful and follow us or join us.

LOW 1hour with Fib Retracement$LOW - Great pattern here - possibly entering calls within the next few days.
I hold them LONG in my portfolios.


$low in a bull flag .$LOW is currently in a bullish flag position. I like the postures of the indicators on the daily, 4 hr, and the 1 hr. Price is currently testing the top of that daily trend expecting a break out move. if the break out occurs, looks like its going to make an attempt at new ATH's. The fib levels are looking good, 175.45 is a level that was briefly used for support back around OCT 16, 2020 when it reached ATHs and got rejected. We are now currently back at those levels. Price is currently 177.59, 1.75% is what it needs to move to make new ATHs.
let me know what y'all think

LOW over 179.46Liking this for a breakout and pre earnings run up. Retail names look strong as well. Earnings next week 2/22.
