LTCUSD - Weekly Up ChannelA large channel can be drawn along the recent bottom on LTCUSD, I expect price to move up.
bottoms can be considered a double bottom.
I'm bullish on alts right now
Weekly chart
LTCBEARUSD trade ideas

Potential bullish rise?LTC/USD has bounced off the support level which is an overlap support and could rise to our take profit.
Entry: 81.80
Why we like it:
There is an overlap support level.
Stop loss: 79.42
Why we like it:
There is a pullback support level which lines up with the 88.6% Fibonacci retracement.
Take profit: 85.83
Why we like it:
There is a pullback resistance level which lines up with the 61.8% Fibonacci retracement.
Please be advised that the information presented on TradingView is provided to Vantage (‘Vantage Global Limited’, ‘we’) by a third-party provider (‘Everest Fortune Group’). Please be reminded that you are solely responsible for the trading decisions on your account. There is a very high degree of risk involved in trading. Any information and/or content is intended entirely for research, educational and informational purposes only and does not constitute investment or consultation advice or investment strategy. The information is not tailored to the investment needs of any specific person and therefore does not involve a consideration of any of the investment objectives, financial situation or needs of any viewer that may receive it. Kindly also note that past performance is not a reliable indicator of future results. Actual results may differ materially from those anticipated in forward-looking or past performance statements. We assume no liability as to the accuracy or completeness of any of the information and/or content provided herein and the Company cannot be held responsible for any omission, mistake nor for any loss or damage including without limitation to any loss of profit which may arise from reliance on any information supplied by Everest Fortune Group.


LTCUSD - Large Rise During Gaussian Channel Down Period As seen in ~2017 the bear phase is very short and leads to a massive rise
I suspect this will occur for Litecoin again after years of weak performance
Great long buy
In the 2017 scenario price was similarly trending under the middle line of the channel.

The ''Pulse'' of an asset times Fibonacci: Chapter 2Every move in a price chart starts with an ''Impulse'', imagine it like a ''Pebble''.
When the Pebble hits water it creates ''Ripples'' that are captured by the Fib Series.
Each Ripple has equal distances between peaks and troughs, or what I call the ''Pulse''.
Each Line has Gravity.
Each Line must be Tested.
Each Line has a Personality.
Every Asset Class behaves this way.
Every Time Frame shows these ripples.
Every Human Brain is susceptible to them.
This is a followup to my previous tutorial linked below.
That one has gotten very long with so many updates as examples.
PLEASE spend some time on the numerous examples in the first publication below:

Could LTC/USD bounce from here?LTC/USD is falling towards a support level which is a pullback support that aligns with the 61.8% Fibonacci retracement and could bounce from this level to our take profit.
Entry: 83.97
Why we like it:
There is a pullback support level that lines up with the 61.8% Fibonacci retracement.
Stop loss: 78.19
Why we like it:
There is a pullback support level.
Take profit: 94.84
Why we like it:
There is a pullback resistance level which is slightly above the 78.6% Fibonacci retracement.
Please be advised that the information presented on TradingView is provided to Vantage (‘Vantage Global Limited’, ‘we’) by a third-party provider (‘Everest Fortune Group’). Please be reminded that you are solely responsible for the trading decisions on your account. There is a very high degree of risk involved in trading. Any information and/or content is intended entirely for research, educational and informational purposes only and does not constitute investment or consultation advice or investment strategy. The information is not tailored to the investment needs of any specific person and therefore does not involve a consideration of any of the investment objectives, financial situation or needs of any viewer that may receive it. Kindly also note that past performance is not a reliable indicator of future results. Actual results may differ materially from those anticipated in forward-looking or past performance statements. We assume no liability as to the accuracy or completeness of any of the information and/or content provided herein and the Company cannot be held responsible for any omission, mistake nor for any loss or damage including without limitation to any loss of profit which may arise from reliance on any information supplied by Everest Fortune Group.

LTCUSD Bullish Robbery Plan To Make MoneyMy Dear Robbers / Traders,
This is our master plan to Heist LTCUSD Bank based on Thief Trading style Technical Analysis.. kindly please follow the plan I have mentioned in the chart. Our target is Red Zone that is High risk Dangerous Level, market is overbought / Consolidation / Trend Reversal at the level Bearish Robbers / Traders gain the strength. Be safe and be careful and Be rich.
Note: If you've got a lot of money you can get out right away otherwise you can join with a swing trade robbers and continue the heist plan,
Loot and escape on the target 🎯 Swing Traders Plz Book the partial sum of money Use Trailing Stop To Protect Looted Money and wait for next breakout of dynamic level / Order Block, Once it is cleared we can continue our heist plan to next new target it will update after the Breakouts.
support our robbery plan we can easily make money & take money 💰💵 Join your hands with US. Loot Everything in this market everyday.

Strong bullish signal on Litecoin weekly chartLitecoin weekly chart is flashing signs of a potential strong move higher. A massive inverse head and shoulders pattern (IH&S) , taking over 1000 days to complete, recently experienced a after breaking above the neckline. This long-term pattern suggests a significant trend reversal could be in play, with the price primed to move substantially above the neckline.
Adding fuel to the bullish fire is the recent formation of a golden cross. This bullish technical indicator appears when the 50-week EMA decisively crosses above the 200-week EMA. Interestingly, a similar golden cross formed shortly after the head of the IH&S broke higher, potentially acting as confirmation for the current breakout.
The confluence of the IH&S breakout and the golden cross suggests a strong possibility of continued upward momentum for Litecoin in the coming weeks.

Litecoin (LTCUSD) Quick Video IdeaEASYMARKETS:LTCUSD
Disclaimer:
easyMarkets Account on TradingView allows you to combine easyMarkets industry leading conditions, regulated trading and tight fixed spreads with TradingView's powerful social network for traders, advanced charting and analytics. Access no slippage on limit orders, tight fixed spreads, negative balance protection, no hidden fees or commission, and seamless integration.
Any opinions, news, research, analyses, prices, other information, or links to third-party sites contained on this website are provided on an "as-is" basis, are intended only to be informative, is not an advice nor a recommendation, nor research, or a record of our trading prices, or an offer of, or solicitation for a transaction in any financial instrument and thus should not be treated as such. The information provided does not involve any specific investment objectives, financial situation and needs of any specific person who may receive it. Please be aware, that past performance is not a reliable indicator of future performance and/or results. Past Performance or Forward-looking scenarios based upon the reasonable beliefs of the third-party provider are not a guarantee of future performance. Actual results may differ materially from those anticipated in forward-looking or past performance statements. easyMarkets makes no representation or warranty and assumes no liability as to the accuracy or completeness of the information provided, nor any loss arising from any investment based on a recommendation, forecast or any information supplied by any third-party.

LTC/USD Targets 1-Month Pivot Point for ConfirmationHello Everyone,
LTC/USD is on an upward trajectory, remaining above the 1-year/1-week pivot point (PP) and steadily moving towards the 1-month pivot point (PP). A strong confirmation of this trend would be if it maintains a consistent position above the 1-month PP.
TradeWithTheTrend3344

Litecoin thoughts - May 2024Litecoin is slowly trending upward since the bottom of the bear market. I am watching this as in reminds me of the price action in the previous cycle. I think it could be a good trade at some point because the market will start looking for unpumped coins. I highly doubt the crypto bull market starts and ends without a litecoin run. Dino coins usually do make for good rotations.

First time BUY signal since 2014LTC appeared to be very bullish, expect to go to at least 450+$.
Not a financial advice

LTC/USD is rising towards 127.2% Fibonacci extension?Price is rising towards a resistance level which is a pullback resistance level that lines up with the 127.2% Fibonacci extension and could reverse from this level to our take profit.
Entry: 83.05
Why do we like it:
There is a pullback resistance level that lines up with the 127.2% Fibonacci extension.
Stop loss: 85.05
Why we like it:
There is a pullback resistance level which aligns with the 78.6% Fibonacci retracement.
Take profit: 79.29
Why we like it:
There is a pullback support level.
Please be advised that the information presented on TradingView is provided to Vantage (‘Vantage Global Limited’, ‘we’) by a third-party provider (‘Everest Fortune Group’). Please be reminded that you are solely responsible for the trading decisions on your account. There is a very high degree of risk involved in trading. Any information and/or content is intended entirely for research, educational and informational purposes only and does not constitute investment or consultation advice or investment strategy. The information is not tailored to the investment needs of any specific person and therefore does not involve a consideration of any of the investment objectives, financial situation or needs of any viewer that may receive it. Kindly also note that past performance is not a reliable indicator of future results. Actual results may differ materially from those anticipated in forward-looking or past performance statements. We assume no liability as to the accuracy or completeness of any of the information and/or content provided herein and the Company cannot be held responsible for any omission, mistake nor for any loss or damage including without limitation to any loss of profit which may arise from reliance on any information supplied by Everest Fortune Group.

LTCUSD SELLWe are already on a bigger corrective phase on Litecoin I'm now expecting a big sell to the downside

Long on LTCUSDMy long-time game plan! LTC looks promising, waiting for BTC's correct phase to be over but for the main time I am DCA on LTC

WHITE-SWAN HARMONIC PATTERN ON LTCCRYPTOCAP:LTC is almost completing a bullish reversal white-swan harmonic pattern on the daily.
I plotted the pattern using the exact required measurement for XB leg at 0.724 max and 0.886XD max.
The pattern gives a reversal area at $68.2

$LTC to Touch $110 After BreakoutCRYPTOCAP:LTC has honestly been having some sort of shitty price action in the previous weeks before now, it is also apparent that there's some bullish catalyst that is currently surrounding it, especially concerning positive news.
Speaking solely from the angle of price action and trend analysis, CRYPTOCAP:LTC has broken out from its long-term consolidation on the 4hr chart and is billed to move higher as the market continues to either consolidate or trend positively.

LTC/USD Eyeing Long-Term Double-Top Completion?Longer-term price action for Litecoin (LTC) versus the US dollar (USD) is on the verge of challenging trendline support, extended from the low of $40.18. With price action failing to print any meaningful highs following the previous test of trendline support, a break below the trendline support could be seen and may serve as an early cue for completing a double-top pattern from around $113.80. The neckline for the double-top pattern resides just below at $54.61.

Is this fractal going to repeat? LTC to 200$?!Found this interesting fractal for LTC, pretty much speaks for itself. So right now we should be at the end of the blue phase, meaning LTC could see a decent leg up to ~140-150$ coming weeks, from there 200$ would be the next target.
To be honest, I wouldn't be surprised seeing this play out :) But we will see!
Stay safe!

#LTC/USDT The plan is to accumulate and hold Litecoin👨💻 I h#LTC/USDT
The plan is to accumulate and hold Litecoin👨💻
I hope that it will bring us big profits by 2025😏

Stable LTC/USD Price Crucial for Bullish MomentumHello Everyone,
To fuel further bullish momentum, LTC/USD must establish stability above the 1-year Pivot Point (PP). Currently, the price has been finding support at the daily Pivot Point (PP), indicating a promising foundation for potential upside.
TradeWithTheTrend3344

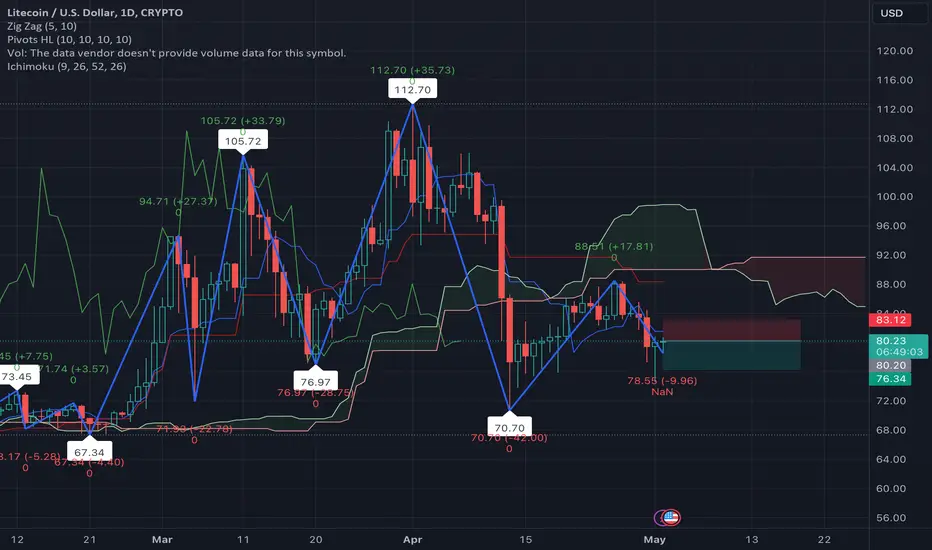
Technical Analysis: LitecoinOverview
As of the latest analysis, Litecoin (LTC) presents a mixed sentiment with a leaning towards a bearish outlook in the short to medium term. The currency's performance over the past week and month has shown significant declines, aligning with the overall sentiment depicted by the majority of technical indicators utilized.
Technical Indicators
Moving Averages (MAs): A strong sell signal is evident as the short-term moving averages (10-day, 20-day, 30-day) are positioned above the current price, indicating downward pressure. The exponential moving average (EMA) for 200 days and simple moving average (SMA) for 200 days are below the current price, suggesting some support in the longer term, albeit the immediate trend remains bearish.
Relative Strength Index (RSI): Currently at 41.41, the RSI remains neutral, reflecting neither overbought nor oversold conditions, but close attention should be paid as it edges closer to the 40 threshold, which might indicate an upcoming stronger bearish momentum.
MACD (Moving Average Convergence Divergence): The MACD remains below the signal line, reinforcing the sell signal and suggesting bearish momentum.
Ichimoku Cloud: The price is below the cloud, confirming the bearish sentiment. The conversion line is below the baseline, which could typically be interpreted as a selling opportunity.
Fibonacci Retracement: The recent price action is hovering around the key Fibonacci retracement levels from the last major high to low. The resistance levels at 87.61 (pivot) could serve as critical points to watch for potential reversals or further confirmation of the downtrend.
Candlestick Patterns
Recent trading sessions reveal a sequence of bearish candles, with the latest showing a small body, indicative of indecision but within a prevailing downtrend. This suggests that while sellers are in control, a reversal could occur if buying pressure increases near key support levels.
Trading Strategy and Price Prediction
Given the current technical setup, traders should consider a short position at the current level of $80.21, targeting the first major support zone around $76.36 (SMA 200-day level), with an extended target towards $71.57 (Fibonacci retracement level S1). A strict stop-loss should be placed around $83.10 (10-day SMA), to mitigate potential losses should a reversal to bullish momentum occur unexpectedly.
For potential long positions, cautious entry is advised only if the price consistently closes above the 200-day moving averages with high volume, which could signal a shift in momentum. An initial target in such a bullish scenario would be the $87.61 pivot point, with a stop loss just below the 200-day EMA at $80.00.