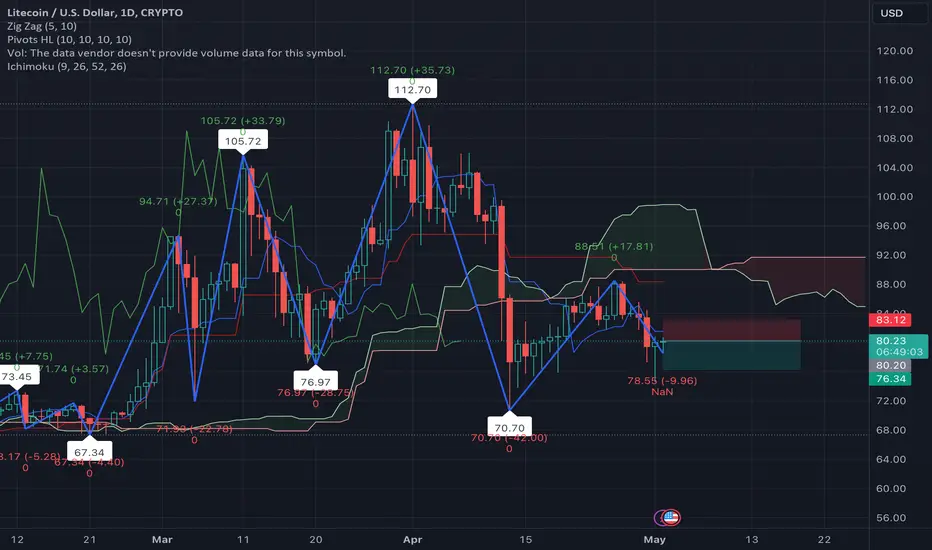
Institutional Access Improved, but Litecoin Still Trades Litecoin’s problem is no longer access. It is conviction.
A regulated U.S. spot ETF has made LTC easier to hold through traditional brokerage infrastructure, yet the price has failed to produce the sustained rerating that institutional access was expected to support.
The latest available filing fr
Litecoin (LTC): Biggest Buy Zone in Years? Multi-Year AccumulatiAfter analyzing Litecoin on the monthly timeframe, I believe we are currently trading inside one of the best risk-to-reward buy zones the asset has offered in years.
For almost five years, LTC has been forming a broad accumulation structure while respecting a major long-term support area around $40
Litecoin Has Access, but Still Lacks ConvictionLitecoin is back at the same 43 area that has already attracted buyers before.
That makes the current reaction worth watching, but the broader structure remains weak.
The four-hour chart still shows a sequence of lower highs beneath descending resistance. Holding support may slow the decline, but
BEUTIFUL BULLISH BUTTERFLY!!! PLEASE FLY, FLY HIGH...Why it matches a bullish Butterfly
Harmonic patterns use specific Fibonacci ratios on a 5-point (XABCD) structure. A bullish Butterfly forms in a downtrend and aims for a reversal higher at D:
XA: Initial impulsive leg up.
AB: Retraces ~0.786 of XA (the defining B-point ratio).
BC: Retraces 0.382–0.
LTC: Buying the FOMC Fear at a Major Accumulation Zoneoday's FOMC decision brought another wave of volatility to the crypto market.
While many traders reacted emotionally to the news, I saw something different on Litecoin.
The selloff pushed price directly into a long-term accumulation zone that has repeatedly attracted buyers throughout previous mar
Litecoin (LTCUSD) Shows Signs of a Potential Bottom FormationLitecoin has reached new lows near the 40 area within a five-wave bearish impulse, where we are now seeing some stabilization, which can be a signal for the bottom formation.
The recent recovery attempt from the lows is starting to show some constructive signs, as Litecoin may be developing a leadi
LTCUSD BUY 46.0On the daily chart, LTCUSD has formed an inverse head-and-shoulders pattern. Attention should currently be focused on the support level near 46.0; if the price pulls back and stabilizes there, further buying could be considered. To the upside, watch the previous supply zone at 51.0–52.7.
LITECOIN [$LTC] EWP TC FIB ANALYSIS WEEKLY TFLTCUSD – The final shakeout before the next impulsive cycle?
Litecoin continues to respect the larger structural roadmap. Price is now approaching the confluence of long-term channel support, historical horizontal demand, and the projected termination zone of the current Elliott Wave decline.
The
LTCUSD: Keep an eye on the demand zoneOn the daily chart, LTCUSD is currently trading at low levels; in the short term, focus on the demand zone between 39.2 and 42.1. If the price pulls back and stabilizes there, consider buying. Monitor resistance near 46.3; a breakout above this level could potentially form an inverse head-and-should
See all ideas
Summarizing what the indicators are suggesting.
Oscillators
Neutral
SellBuy
Strong sellStrong buy
Strong sellSellNeutralBuyStrong buy
Oscillators
Neutral
SellBuy
Strong sellStrong buy
Strong sellSellNeutralBuyStrong buy
Summary
Neutral
SellBuy
Strong sellStrong buy
Strong sellSellNeutralBuyStrong buy
Summary
Neutral
SellBuy
Strong sellStrong buy
Strong sellSellNeutralBuyStrong buy
Summary
Neutral
SellBuy
Strong sellStrong buy
Strong sellSellNeutralBuyStrong buy
Moving Averages
Neutral
SellBuy
Strong sellStrong buy
Strong sellSellNeutralBuyStrong buy
Moving Averages
Neutral
SellBuy
Strong sellStrong buy
Strong sellSellNeutralBuyStrong buy
Displays a symbol's price movements over previous years to identify recurring trends.