MATIC BULLISH SCENARIOseeing the current price of Matic is really good for looking a price that we will buying for , soon it will sky rocket with 600+% price hike
MATICUSDT trade ideas

MATIC polygon analysisThere was a fall alert from about $1.20 because btc said so.
I assumed that, you didn't know that? Then I know you didn't follow my btc analysis.
Matic tells us what the market situation of other coins will be in the near future.
A 30% drop is not surprising, we exist in a pyramid scheme, this is normal.
My real giga deal is point c, not the giga level in the analysis. If this level is reached, it is perfect. btc decides where point c lands!!
I could be wrong, but it could be absolutely true

BB + CCI + RSI + S/R strategy PortfolioOpen a Long Position when:
The asset is oversold (RSI less than -100 and moving up).
The RSI is below 30 and moving up.
The asset is hitting support.
Open a Short Position when:
The asset is overbought (RSI greater than 100 and moving down).
The RSI is above 70 and moving down.
The asset is hitting resistance.

MATICUSDT IDEA#MATICUSDT
Hey dear traders hope you are enjoying trading and analysis with our team. we are here to discuss about MATICUSDT
MATIC is making Ascending channel in 8h time frame
Breakout done & price Dropping continuously ✍

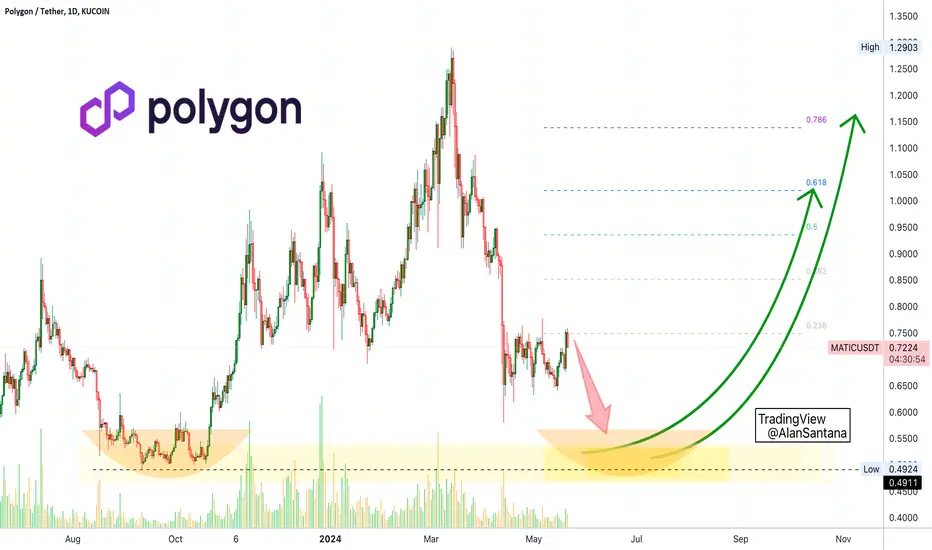
✴️ Polygon (MATIC) Lower Low 30% Drop Before Bullish WaveNotice how yesterday's session is not that strong—Polygon (MATICUSDT).
Notice how today we have red rather than green.
This level of weakness implies that a new low is likely coming in the following weeks and that is something that we have been expecting and welcome because there will be better opportunities when prices are low.
Imagine buying at the market bottom and enjoying GREEN/Up for the entire 2024/25 bull-market. As soon as you buy, prices grow.
👉 For this to be possible patience and experience is needed and of course, we have to wait for the correction bottom low.
Q: How do we know that the market is moving lower?
A: We do not know.
What we know is what the chart is saying now... The market has been moving down since 13-March and this down-move seems to be reaching its end, according to what the chart has to say.
👉 Remember, if you are a beginner, you can just hold and buy more once support is reached.
For beginners, the best course of action is "buy and hold." That is, buy and if somehow you made a mistake just wait and buy more each time prices drop. This is how I personally do it for long-term success and gains. This is not financial advice of course and you need to do your own research.
The reason why you need to do your own research is because of the risk; money can be lost. If you lose money, that is your responsibility because you did the clicking, you made the decision. Here we all share information freely yet we are all adults.
Keep in mind that the market can quickly reverse and move up rather than go down and I can be completely wrong, this happens all the time.
We are reading the charts and using our knowledge and experience to make predictions. Sometimes we simply translate what is written on the chart.
Sometimes we get it right, other times we get it wrong.
All the professional traders in the world will easily tell you that the true winners are not those that have a 90% success rate but rather those that have a winning strategy and those that know how to take a loss.
... More?
Leave a comment and I shall expand.
Thanks a lot for your continued support.
Namaste.
#MATICUSDT | DAILY TIMEFRAME ANALYSIS #MATICUSDT | DAILY TIMEFRAME ANALYSIS
#POLYGON could be a good midterm and long-term investment
Based on the top-down analysis from the monthly chart to the daily chart, #POLYGON is BULLISH and I'm looking for higher prices on #MATIC. ⬆️
To open a LONG position, you can look for confirmation on lower time frames. You can also purchase it from the spot market and hold it with a stop-loss below $0.4900. ✔️
Short-term objectives are: $0.6230 - $0.6400 - $0.6650 ✅
Intermediate objectives are: $0.6900 - $0.7160 - $0.7400 - $0.7800 ✅
The long-term objectives are: $0.8200 - $0.8600 - $0.9100 - $0.9800 ✅

$MATIC looks good!#MATIC looks good, the support is stable and it looks good for the next bullrun, first scenario is that it can re-test the resistance line, but if it breaks it it will explode

Matic Symmetrical TriangleLong Matic Symmetrical Triangle setup that is years in the making.
Stops Under 0.5

Matic #LONG #VIRAL # IDEAMatic is on the brink of a major price surge, indicating a favorable opportunity to enter a long position and benefit from the anticipated upward movement.

MATIC Nears Crucial Support Level: Key Insights and Triggers🔍MATIC (Polygon) is approaching a critical support level. Here's an in-depth analysis to guide your trading decisions.
📆Coin of the Day: MATIC (Polygon)
About the Project
MATIC is a layer-2 scaling solution for Ethereum, known for its low transaction fees and extensive use in the DeFi space.
🧩Technical Analysis
4-Hour Timeframe
This analysis focuses on futures trading, highlighting multiple scenarios.
📉Support and Resistance: The price has reached the bottom of its consolidation range, with key support at $0.6449. A confirmed break below this level could signal further downside. The immediate resistance levels are at $0.6676 and $0.7491.
📈Bullish Scenario: If MATIC can hold above the $0.6449 support level and Bitcoin stabilizes, a potential bounce could occur. Key resistance levels to watch are $0.6676 and $0.7491. A break above these levels would indicate renewed bullish momentum.
📉Bearish Scenario: Bitcoin has recently been rejected from a significant supply zone, contributing to MATIC's decline. A break below $0.6449, confirmed by a retest, could lead to further downside, with the next support level at $0.5057.
📊Volume and RSI: Volume has been decreasing overall, except for a significant sell-off candle recently. The RSI has broken down, indicating bearish momentum. Key RSI levels to watch are 24.46 and 23.29 for potential oversold conditions.
💡Key Triggers: Monitor the price action around the $0.6449 support level. A break and retest of this level could provide a clear signal for further downside. Conversely, a hold above this level, coupled with stabilization in Bitcoin, could trigger a potential bounce.
👨💻Trading Positions
Long Position
Entry Trigger: Hold above $0.6449 with confirmation from RSI and volume.
Strategy: Open a position on the hold of this level, targeting $0.6676 and $0.7491. Use tight stop-loss orders to manage risk.
Short Position
Entry Trigger: Break and retest below $0.6449.
Strategy: Open a position if the price confirms a break below this level, targeting $0.5057. Adjust stop-loss orders accordingly.
📝MATIC is testing a crucial support level, with significant implications for future price movements. Traders should monitor key levels and triggers for potential entries and exits. Volume and RSI indicate bearish momentum, while support at $0.6449 is pivotal.
🧠💼Always remember the inherent risks in futures trading, with the potential for margin calls if risk management is neglected. Stick to strict capital management principles and use stop-loss orders, ensuring an initial target with a risk-to-reward ratio of 2.
🫶If you found this analysis helpful and want to support me, please boost this analysis. Feel free to leave a comment or suggest a coin you'd like me to analyze next.

Potential $MATIC SetupYou should be able to understand what I've drawn on the chart, else I'd recommend u not even think about taking the setup

MATIC is illI've waited for ages for this matic setup to squeeze, but for some reason its doing the opposite of what i expected.
As you can see it had an initial fake out for the bulls, is it going to double fake out and still go bull?
This is looking bad so far for MATIC.
I'm looking for an entry on a small move up. It's looking like BTC is about to crap its pants and take down the alts.
One thing is for sure, i aint touching matic longs.

MATICUSD 1WMATIC ~ Updated
#MATIC Continue accumulating in this pattern.
The accumulation range is narrowing. It's only a matter of time that this pattern is successfully broken. Target is at least 20%+ for the short term


MATIC USDT 1D control levelsMATIC-USDT 1D
You have to wait for a return signal to enter.
The SL levels are:
SL1 0.48
SL2 0.32
TP levels:
TP1 1.15
TP2 1.41
TP3 1.61
TP4 2.72
MATIC-USDT 1D
Hay que esperar una señal de vuelta para entrar.
Los niveles de SL son:
SL1 0.48
SL2 0.32
Los niveles de TP:
TP1 1.15
TP2 1.41
TP3 1.61
TP4 2.72

#MATIC/USDT#MATIC
The price is moving within a descending channel pattern on a 4-hour frame, which is a retracement pattern
We have a bounce from a green support area at 0.6000
We have a tendency to stabilize above the Moving Average 100
We have a downtrend on the RSI indicator that supports the rise and gives greater momentum and the price is based on it
Entry price is 0.6270
The first target is 0.6582
The second goal is 0.7218
The third goal is 0.7742

MATICUSDT UPDATE #MATICUSDT
Hey dear traders hope you are enjoying trading and analysis with our team. we are here to discuss about MATICUSDT
Moving Exactly AS we Expected
Price dropping continuously

MATIC/USDT Daily Technical AnalysisBINANCE:MATICUSDT
The chart is a daily chart of MATIC/USDT (Polygon/Tether) .
Here are some key observations and technical analysis based on the chart:
1. **Current Price**: The current price of MATIC is around 0.5851 USDT.
2. **Demand Zone**: There is a highlighted demand zone below the current price level, indicating potential support where buyers might step in.
3. **Supply Zones**:
- Around 0.9789 USDT: This is a significant supply zone where sellers might exert pressure, potentially causing the price to reverse or face resistance.
- Around 1.2900 USDT: Another supply zone where significant selling pressure can be expected.
4. **Volume Profile**:
- The volume profile on the right side of the chart indicates areas with high trading volume which act as support or resistance. Notable volume nodes are visible around 0.6200 USDT and 0.6798 USDT.
5. **Fibonacci Levels**:
- There's a Fibonacci retracement level around 41.52% and 58.48%, possibly aligning with the supply zones.
6. **Price Action**:
- The price has been in a downtrend since early April.
- There are marked POIs (Points of Interest) at 18, 21, 22, and 23 levels on the chart, which might represent significant areas of support/resistance based on historical trading activity.
### Technical Indicators and Strategies:
- **Support and Resistance**: Watch for price action around the demand zone and the supply zones. The demand zone below the current price could act as a strong support level.
- **Volume Profile**: Areas with high volume can provide additional confirmation for support and resistance levels.
- **Fibonacci Retracement**: Use the Fibonacci retracement levels to identify potential reversal points.
### Potential Trading Strategy:
- **Long Position**: If the price shows strong support around the demand zone and begins to rise, it could be an opportunity for a long position, targeting the nearest supply zone (around 0.9789 USDT) for profit.
- **Short Position**: If the price fails to hold the demand zone and breaks below, consider a short position, targeting lower levels such as 0.4900 USDT or further based on the downtrend continuation.
### Summary:
- **Current Support**: Around the demand zone below the current price of 0.5851 USDT.
- **Current Resistance**: Around the supply zones at 0.9789 USDT and 1.2900 USDT.
- **Volume Profile**: Key levels to watch are 0.6200 USDT and 0.6798 USDT.
- **Trend**: The overall trend appears bearish, with a potential reversal if strong support is found at the demand zone.

Matic Is Ready MATIC/USDT is currently attempting to break out of the trendline resistance, with the structure now showing signs of bullishness. I anticipate a strong bullish move in the near future. I will be waiting for the breakout, and if it does occur, my target is a 30-60% increase.
Please note that this is not financial advice. Do your own research (DYOR) before making any investment decisions.

MATICUSDT1. Matic Selling Plan.
2. Nice clean supply zones to take profit.
3. Hasn't performed the best so far compared to others but maybe 4-5x from here.

MATIC - Ranges overview Here is a quick look into what I will be looking at on MATIC
We are currently trading below the ranges lows. In comparison to other trades this is a long term trade and PATIENCE is KEY
IF we reclaim and hold 0.75$ expect us to hunt the buyside liquidity resting around 1.1710$
IF we fail to break and hold above 0.75$ expect us to trade back towards the sellside liquidity resting around 0.5835$
Stay safe and never risk more than 1-5% of your capital per trade. The following analysis is merely a price action based analysis and does not constitute financial advice in any form.

MATICUSDT.PHello Trader BINANCE:MATICUSDT.P
Market price consolidation in the 0.68-0.70 area has been passed and is valid for breakout. and the price in this range can be said to be valid for bullish in a short time, this area is suitable for scalping in a short time frame
Please add a comment and Positive feedback and constructive criticism are important to authors and the community.
Disclamer: Not Financial Advice

$MATICUSDT is loadedI believe that the pair BINANCE:MATICUSDT is ready to move up much faster. I propose x10 profit in 3 months.
Does not constitute a recommendation.
#furoreggs #investing #currency #idea #forecast #trading #analysis
If you want to discuss, please subscribe and challenge this point of view. If you want to get more, please join my channels
