MATICUSDT trade ideas

$MATIC Swing ShortAveraged-in around 0.72
Stops currently flat.
See the previous two trendline breaks? Yeah..... enough said.
Targets marked. Let's see.

MATICUSD ❕ strong supportRSI indicates oversold on the 4H TF.
TD Sequential formed an up reversal signal at 1H TF.
I think the asset will correct after testing the support.

Very LONG ✅ 🦅First Follow This Page For Giving A Profitable Signals 🦅💰✅
SECOND we have long or buy vision for this POSITION ✅
THIS is not financial advise or something like that ...
Thai is just our trade POSITION ✅🦅

MATIC shortHello guys , If we close below 0.94c I expect a big fall down. It only has an hour to go.
Give me like if you agree !

MATICUSDTPossible setup for BINANCE:MATICUSDT
"Daily crypto market analyses I provide are personal opinions & not financial advice. Trading carries risks, so do your own research & seek advisor's help."
Don't forget to like and comment

MATIC/USDT Chart ReviewI invite you to review the MATIC chart in pair to USDT, on a one-day interval. First, we will use the blue lines to mark the downtrend channel where the price is moving in the upper range.
Moving on, we can move on to marking support areas when we start a larger correction. And here the first very strong support is at the price of $0.59, but when the price drops below, we can see a drop to the support of $0.31.
Looking the other way, we see that the price has rebounded from the first significant resistance at $ 0.90, which so far has no strength to break. then second resistance is at $1.03, then we have another resistance zone from $1.16 to $1.34, then strong resistance at $1.56.
When we turn on the EMA Cross 200, we see that the price rebounded from this line and thus remained in a strong downtrend.
Please look at the CHOP index, which indicates that there is still energy for this move, the RSI has a strong rebound with room for the price to go lower, while the STOCH indicator also indicates that there is some energy left for the next move.

What's Next Possible Move of MATIC/USDT? Polygon Analysis💎Attention, Paradisers! Turn your focus to MATIC, as it's gearing up for potential movements, offering a few captivating possibilities.
💎MATIC faced resistance at the OB a few days ago, sparking an upward trend. Yet, with a hint of slowing momentum, it's projected to re-engage with the OB. Should it falter at this juncture, anticipate a bullish continuation from a key support point.
💎Delving into its trajectory, we've noticed a shift from demand to supply, resulting in a pronounced dip.
💎After capturing liquidity from below, MATIC seems primed to climb, targeting the overhead imbalance.
💎Keep a close watch for further insights and relish your trading adventure.

Buy matic here Over sold on four and one hour time frame. So am building my buying /long from from here

Am buying a small bag The rsi indicator is showing over sold on one hour time frame and even four time frame is showing the same movement.

Homework_manvelov_rev_patterns_3This is addition to homework n1 where 3 patterns are added
Addition N3 where BR2 is important

Pragmatic view on Maticcompleted abc, nice channeling, nice QML, fear not, attacking the dumb money liquidity on top of the B wave.

MATIC. Glitch in the Matrix.The situation is rather strange and uncertain. Two patterns formation signals more for a downward movement, but! There is no on-chain prerequisite for this... A fall to $0.11 = drop capitalization in six times - I don't believe in it. The ecosystem is developing, the whales are still profiting from their bags using DeFi, so... Also, there is no premise for a 500% increase since this is not a bullish cycle, but a thaw. In addition, achieving this target involves breaking through ATH. Unlikely.
Given all this, I will assume that the asset will have an ongoing sideways trend and we will not see tangible movements in either direction. But keep in mind that things can change.

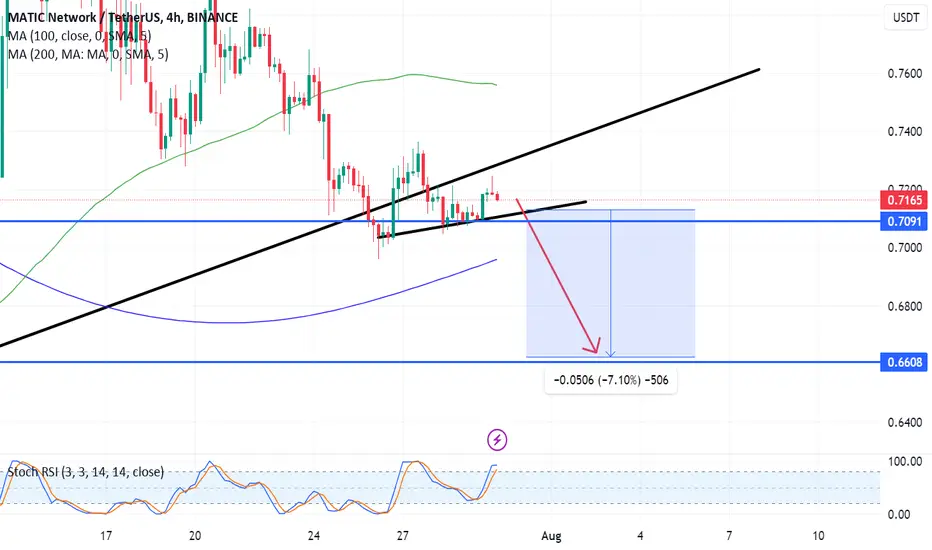
Matic Possible Playout ChartThe price movement of MATIC is predicted to weaken due to the decline in Bitcoin's price. This weakening is indicated by a recent appearance of a doji gravestone, suggesting a possible reversal for MATIC towards the support area at $0.7091. However, this support is considered weak because, on a larger daily time frame, MATIC has already broken below its support line.
Therefore, it is better to wait and see (#DYOR - Do Your Own Research). There is potential for buying at $0.6608, but it is essential to conduct thorough research and consult reliable financial sources before making any investment decisions.
MATIC/USDT - Potential Trend Continuation to BullishAfter Continous HHs and HLs, this pair has formed a bullish rectangle, suggesting a potential trend continuation to bullish.


Polygon Matic price will try to work out a medium-term tradeMatic buyers are not giving up and are trying to break through the local trend and strong liquidity zone from above.
We assume that there will be more attempts to push the price up, so this medium-term trade has the right to live:
Entry = $0.636
Stop = $0.5582 (-12%)
Take Profit = $0.9595 (+50%)
Potential profit/loss ratio = 12/1
_____________________
Did you like our analysis? Leave a comment, like, and follow to get more

MATICUSDTLog in when you are approved to log in
The closer the shopping points are to the green box, the better

MATIC TO TAKE OVERHello Traders and everyone, I am Hadi Karaali, Known as SNIPERS_FX
If you like the idea, do not forget to support with a like and follow.
QUICK UPDATE ON MATIC,
As we can see price is now sitting around a strong support zone previously acting as a resistance!
So, for now we will be looking of new buy setups as we are still around a strong support zone.
Moreover, price is still overall bearish as a correction movement, However, for the bulls to take over we need a break above the marked major swing high.
Then a movement higher would be expected.
Until that price is still bearish, and price can still trade lower and lower.
If you like this kind of analysis don't forget to like and follow
and as usual follow your trading plan and manage your risk.
Be patient and good luck!

#MATICUSDT #LQR #TOBTC #LaqiraProtocolWe are in a downtrend so that as long as the zone of 1 dollar has not been broken and has not stabilized, the trend will continue to be bearish. Levels have been obtained from the intersection of static levels and fibo level . After confirmation and matching with bitcoin levels you can open the position this analysis is not an offer to buy or sell

MATICUSDTAUDUSD was trading in falling wedge pattern and now has given the breakout from falling wedge..
Currently the price is struck in a small range with certain clear direction of breakout to the upside.
If the price close above 0.7020 one can trade with buy stop for nice bullish rally.

MATIC - Shift In Momentum - Practical Example 📚Dear TradingView community and fellow traders,
I am Richard, also known as theSignalyst.
The MATIC H4 chart has captured my attention due to its intriguing momentum structure shift.
📉 Following its rejection from the 0.9 - 1.0 resistance zone, MATIC has entered a bearish phase, marked by lower lows and lower highs— a classic MarkDown phase .
However, a noteworthy observation is the diminishing size and flattening of the impulse movements.
According to Charles Dow, this signals an early alert for a potential shift in momentum, which brings us to the Accumulation phase as per Richard Wyckoff.
Presently, MATIC appears to be consolidating within a significant range, spanning from 0.65 to 0.7 — an evident Accumulation phase.
🏹 For the bulls to take over, and the MarkUp phase to start, we need a momentum candle close above 0.7 zone marked in green.
I hope you find this post useful, and I would appreciate your likes and support.
Which scenario do you think is more likely to happen first? and why?
📚 Always follow your trading plan regarding entry, risk management, and trade management.
Good luck!
All Strategies Are Good; If Managed Properly!
~Richard
