MATIC PRINTING HH & HLMATIC AFTER BEARISH TREND PRINTED DIVERGENCE AND NOW PRINTING HH & HL So We took entry through FIB 0.382 level by Buy Limit Order.
MATICUSDT trade ideas

MATICUSDTMaticusdt support and resistance play if matic cross second support we will enter in it to ride

sell maticIt will climb up to the 0.58 area and experience a deep fall from the area up to 0.39.
But after that, in my opinion, it is the best opportunity to buy and accumulate evolutions.

MATICUSDT Analysis: Is a Double Bottom in the Making?Introduction
Cryptocurrency markets are known for their rapid price movements and pattern formations, and MATICUSDT is no exception. At its current price of approximately 0.546 USDT, MATIC appears to be hinting at a potential double bottom pattern, which could be a significant development for traders and investors. In this analysis, we will delve into the details of this pattern and discuss potential price targets, all while keeping a watchful eye on the Bitcoin market, which continues to lead the way. Additionally, we'll take a look at the economic events calendar for the week to assess any potential market-moving influences.
Double Bottom Pattern on MATICUSDT
A double bottom is a bullish reversal pattern that often signals a potential trend change. It forms after a significant downtrend and consists of two distinct troughs at roughly the same price level, separated by a peak (the neckline). The pattern is considered confirmed when the price breaks above the neckline, which serves as a resistance-turned-support level.
Currently trading around 0.546 USDT, MATIC appears to be carving out the first trough of a potential double bottom. To confirm this pattern, we'll need to see the price decline to form a second trough in a similar price range. The neckline would be drawn through the peak that separates the two troughs.
Potential Price Targets
If the double bottom on MATICUSDT materializes and the price breaks above the neckline, traders often use a measured move technique to estimate potential price targets. This involves measuring the distance between the neckline and the lowest point of the pattern (the lowest trough) and then adding that distance to the neckline's breakout point.
In this case, if the pattern confirms and the price breaches the neckline, the potential target range could be between 0.658 to 0.666 USDT. However, it's important to note that patterns in the cryptocurrency market can be subject to rapid changes, so careful monitoring and risk management are crucial.
Bitcoin's Influence
While MATICUSDT is showing promising signs of a double bottom, it's essential to remember that Bitcoin continues to be the market leader and can significantly impact the entire crypto space. Bitcoin's price movements often dictate sentiment and trends in the broader cryptocurrency market, including MATIC.
Given this, it's advisable to keep a close watch on Bitcoin's price and any major developments in the Bitcoin market. Any sudden shifts in Bitcoin's direction could influence MATIC and other altcoins.
Economic Events Calendar
As we navigate the cryptocurrency market, it's worth noting that this week lacks major market-moving economic events. In the absence of significant external factors, technical analysis and pattern recognition become even more critical in shaping trading decisions.
Conclusion
MATICUSDT is currently hinting at the formation of a potential double bottom pattern, which, if confirmed, could lead to a bullish trend reversal with price targets in the range of 0.658 to 0.666 USDT. However, it's vital to exercise caution, as cryptocurrency markets can be volatile and subject to sudden changes.
Additionally, the influence of Bitcoin remains a key factor to monitor, as its movements can have a cascading effect on the entire crypto space. While this week lacks major economic events, keeping a close eye on market developments is essential for informed and prudent trading decisions.
As always, risk management, thorough analysis, and staying informed about market dynamics are essential components of successful cryptocurrency trading. Happy trading, and may your decisions be profitable!

MATIC short - swing trade Entered a short on MATIC looking for 0.3200$ with some of the profits taken from the APE short.
Invalidation is clear and we are expecting BTC to weaken and drop soon - hence the rest of the market should follow accordingly.
Plan is clear and we should have a strong push down in my opinion. We have failed to create new highs and price has been consolidating and trapping the bulls.
Stay safe and never risk more than 1-5% of your capital per trade. The following analysis is merely a price action based analysis and does not constitute financial advice in any form.

My Short idea on maticusdt.p I expect matic to clear those lows ,
My entry was blue line -
Stoploss red line above
Targets are grey
You can always find low time frame short opportunities

MATIC/USDT 1D Interval ReviewHello everyone, I invite you to review the MATIC chart in pair to USDT, on a one-day interval. Let's start by marking with blue lines the strong downtrend channel in which we are currently moving. At this point, it is worth checking the EMA Cross 200 right away, where you can see the place where the price was rejected while remaining in a strong downtrend.
Going further, we will check where the price should meet support, but for this purpose we will use the Fib Retracement and Trend based fib extension tools, after spreading the grids, we can mark a strong support zone in which the price is currently from $ 0.64 to $ 0.49 , however, when this zone is broken, we can see a drop around the second equally strong zone from $0.36 to $0.24.
Looking the other way, we see that the price has been rejected in the first resistance zone from $0.76 to $0.91, only when we exit it upside price moves towards the second zone from $1.03 to $1.16 to continue make an attack at $1.34 and then resistance at $1.56.
When we look at the CHOP index, we can see that there is still energy for the current move, on the RSI we have a rebound with room for a further downward move, but on the STOCH indicator we can see that we are approaching the lower limit again, which can stop the decline and give a sideways move .

MATIC/USDTA weekly close below this trendline could lead to further downside, approximately around 0.32.

Matic: Reversal or Trend Continuation Pattern?Matic: Reversal or Trend Continuation Pattern?
Since when BTC created the big crash on August 17 we can see that Matic began a correction process.
If we compare Matic to the other altcoins it is holding stronger and the price didn't create a new price low like many ALTs already did.
We can clearly see that 0.528 proved to be a very strong Key Support Area.
However considering that the price is still in a correction process both possibilities are still valid for the bullish and for the bearish movement.
Thank you and Good Luck!

MATIC short - swing trade Entered a short in MATIC. Tight stop for now above the current highs capping the market.
IF we reclaim the top of the range I will look to reduce my position. Overall plan is bearish and expecting 0.62 to be the last line in the sand.
0.62 is the overall invalidation.
TP 0.50
TP 0.45
TP 0.3160
SL above current highs (0.62 is the point of reference for the overall trade invalidation)
Stay safe and never risk more than 1-5% of your capital per trade. The following analysis is merely a price action based analysis and does not constitute financial advice in any form.

Matic Ascending pattern | Horizontal ResistanceJoin us in this video as we analyze the MaticUSDT trading pair and highlight the exciting developments taking place. MaticUSDT is currently forming an ascending triangle pattern, with a horizontal resistance level at $0.89.
In this insightful analysis, we explore the potential outcomes based on different scenarios. If the resistance at $0.89 is successfully broken, we could expect the price of Matic to reach around $0.95. This breakout could signal a bullish trend and present potential buying opportunities for traders.
However, it's essential to consider the other side of the coin. If the lower trendline support, located at $0.85, is breached, it may indicate a short call, suggesting a bearish trend reversal.
Stay tuned as we delve deeper into the technical aspects, chart patterns, and key levels to watch in MaticUSDT trading. Enhance your understanding of this market and gain valuable insights for your trading strategies.
Don't miss out on this informative video that covers the analysis of MaticUSDT and provides actionable information for traders and crypto enthusiasts. Stay informed, make well-informed decisions, and navigate the dynamic world of cryptocurrency with confidence!
#MaticUSDT #CryptoTrading #TechnicalAnalysis #AscendingTriangle #ResistanceLevel

MATIC - Ranges overview MATIC is not the cleanest of charts but most definitely has some of the cleanest targets.
Trade idea is pretty simple.
IF we reclaim and hold above 0.5570 I would expect an aggressive move towards 0.60 and maybe higher.
IF we fail to reclaim and deviate expect pa to head towards the 0.50 and 0.43 liquidity.
For now sit on your hands and wait for the market to tell you its story and where it wants to go by following the prints it leaves in the market. Like a hunter waiting for his prey you do not jump out and chase it... you wait for it to come to you and execute. Trading is not so different, the only difference lies in us having multiple trade ammunitions taking the form of our liquidity and capital preserved by good risk management.
Stay safe and never risk more than 1-5% of your capital per trade. The following analysis is merely a price action based analysis and does not constitute financial advice in any form.

Head Shoulders is creatingChart 4H TF
BINANCE:MATICUSDT is creating a inverse head shoulders
Matic has the support around 0.53 so need wait a confirmation
Wait for next move to see happen

#MATIC HTF super bearishIn this chart I tried to predict all possible scenarios and highlighted the most strong resistance (red lines) and support (green lines) levels.
Since I am trying to make understanding my TA easier. I marked every possible move of the coin with numbers.
Now let me explain every number:
1. Matic bounces until Monthly 50 ema support at the level 0.63$ and from that level we get bear reaction. It can be long wicks above the candle or bearish divergence on LTF. In this case the probability to see downward move towards to 0.25$ increases
2. The coin goes higher to 0.72$ where it faces with W FVG and D 100 ema resistance - we see bears reaction in this case price comes back to 0.63$ and below.
3. Coin breaks through 0.72$ resistance, retests that level ( because it becomes a support) and in this case the continuation of the uptrend increases and we may see the coin around 0.92$
4. The coin faces 0.92$ where there is M FVG + Weekly 50 and 100 ema resistance. We see bears reaction in this case Matic welcome back to 0.72$
5. The coin breaks through 0.92$, would be nice to see the retest of that level, in this case the coin go higher to 1.1$ and etc

MATIC long term perspectiveBased on the weekly timeframe's Trendline and Chart Pattern , here's my outlook on how the price of MATIC might evolve over the next few months

Matic possible drop downOn a weekly timeframe, we can observe a downtrend in Matic within a parallel channel, following the pattern of Lower Highs and Lower Lows, which constitutes a bearish structure. Moreover, if we connect the lows of June 2022 and June 2023, we can identify a robust support line. However, this line has now been breached, leading to a decline in Matic's price. The RSI on a weekly level is at 33, indicating an oversold condition that is yet to manifest fully. The MACD has remained in negative territory for over 4 months.
The level of $0.58 served as a sturdy support for Matic, providing strength during the Bitcoin crash from $30,000 to $25,000 in June 2023. Subsequently, Matic's value surged above $0.85. However, during the recent crypto market crash, Matic failed to maintain this support and commenced a breakdown. Presently, Matic is trading at $0.54. It has already closed below $0.58 and is undergoing a decline. Matic's RSI is at 22, and the MACD remains in negative territory, indicating an oversold condition. This suggests a potential minor rebound in the upcoming days. Nevertheless, comprehending the current market sentiments is crucial. If the sentiments exhibit sufficient strength, a recovery to $0.58 might be possible. Nevertheless, our previous sentiment analysis indicates poor market performance, highlighted by the dismal weekly closure last week. A staggering amount of over $1 billion was liquidated from the market in a single day, instilling fear among retail traders. Moreover, market volume remains lackluster. The sentiments are decidedly bearish for now. Should we observe a decline in traditional markets like NASDAQ and S&P500, a corresponding drop in cryptocurrency prices can be expected.

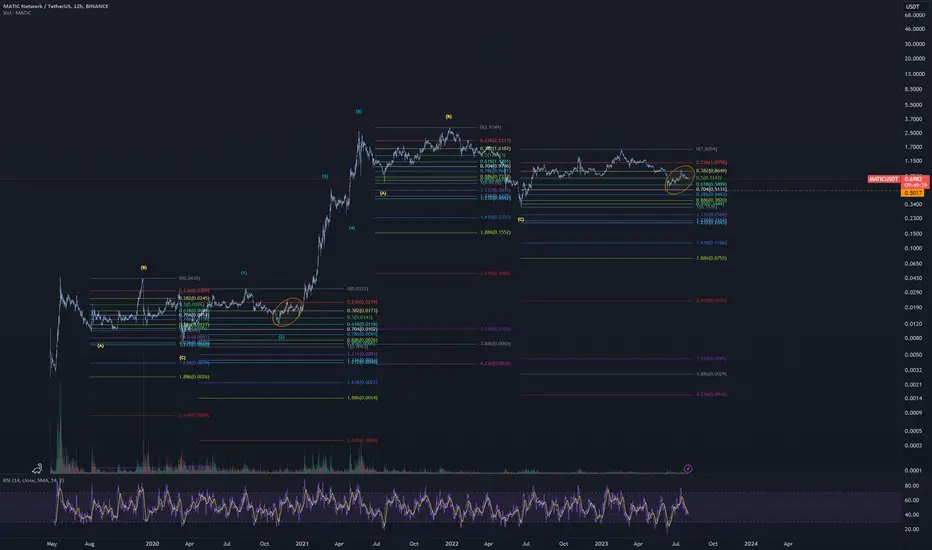
MATIC Fib levels remain ultra bullish until...Lets see what we had in the first run:
Corrective ABC on 1.272 for C after first leg and sharp bounce on right on 0.618 after the following impulse's correction
Lets see what we just had:
Corrective ABC on 1.272 for C after first leg and sharp bounce on right on 0.704 after the following impulse's correction
Suppose while the recent low @ $0.5131 holds bulls are in favor to hit their final 4.236 fib target > $18
If it doesnt hold, next levels to watch out would be 0.886 @ $0.38, 1.272 @ $0.2 and finally the recent breakout zone $0.03
---
If you like my content, if it helps you gain profit, give it a like!
Thanks!
---
Hold my beer pls
----
No financial advice, do your own research, don't be stupid
Matic rangingWaiting for Matic to break the current range
Matic is moving towards the previous low, with this volume a new low is to be expected.

MATIC/USDT longDirection: ⬆️LONG
--
Position Size: 2 - 4%
Leverage : 3 -5X
Trade Type: SWING
--
Lying above the horizontal support
ENTRY : 0.51 - 0.579
(OTE: 0.54 )
🔘Target 1 - 0.59
🔘Target 2 - 0.61
🔘Target 3 - 0.63
🔘Target 4 - 0.65
🔘Target 5 - 0.68
🔘Target 6 - 0.72
🔘Target 7 - 0.76
🔘Target 8 - 0.80
🔘Target 9 - 0.85
🔘Target 10 -0.90
🚫STOP LOSS: 0.49
RISK: Medium/High

#LQR #TOBTC #MAtic 3DayThese Price lables are important support zone for Matic
which is gives you mid-term Spot Trade ...
Do you'r own re-search DOYR!


#MATICUSDTthis pattern has been defined as a TREND pattern in which wave 3 is extende . it is the most probable trend pattern to occur very often wave 1 is equal to wave 5 in time and price when a third wave is extende .
Wave 4(ZigZagFlat):
this pattern has been defined as a sharp Corrective pattern which is ahybrid of a zigzag and a flat.the B wave retraces more than 62% and the A and C wave should be a trend pattern.
This wave 4 will be ended at 0.2858 or 0.1371, but 0.1371 will be more likely.

Swing Trade - MATICFor this setup what I'm looking to take is a momentum and moneyflow reversal SHORT either at the Previous Range VAL, the PoC (Point of Control), or the bottom of the previous Channel.
Depending on the opening on Tuesday after the holiday, we'll see how fast MATIC moves and note this compared to BTC/ETH to get an indication at which level we should see the stall occur and take a reversal.
I would be interested in a LONG if MATIC pumps through the bottom of the channel and retests the channel bottom.
Good Luck!
