Matic LONG🐮 Matic is seeking upward movement as it consistently achieves higher highs and converts resistance into support.
MATICUSDT trade ideas

MATICUSDT.4HBased on the technical analysis of the MATIC/USDT 4-hour chart provided, here’s a detailed and professional first-person analysis in English:
Upon examining the MATIC/USDT 4-hour chart, several key technical indicators and levels emerge, providing insights into potential price movements.
Trend and Resistance Analysis:
The chart shows that Matic (MATIC) has been in a consolidative phase with the current price around 0.7497 USD. The price is currently trading between the support and resistance levels, attempting to break above the immediate resistance level marked as R1, around 0.9511 USD. A successful breakout above this level could lead the price to test the next significant resistance at R2, which is around 1.2900 USD. The overall trend shows a gradual upward slope supported by a rising trend line (S1), indicating increasing buying pressure.
Support Levels:
On the downside, the primary support level is identified as S1 at 0.5885 USD. This level has shown strong buying interest previously and could act as a floor if the price starts to decline. The rising trend line further reinforces this support level, suggesting strong demand around this price zone.
RSI and MACD Indicators:
The Relative Strength Index (RSI) is currently at 50.72, indicating a neutral position. The RSI is in the middle range, suggesting that the market is not overbought or oversold, allowing for potential upward movement. The Moving Average Convergence Divergence (MACD) indicator shows a neutral to slightly bullish trend, with the MACD line (blue) close to the signal line (orange)
and the histogram indicating minimal momentum. This suggests that while there is no strong momentum currently, the potential for bullish movement exists.
Volume Analysis:
The volume pattern indicates moderate trading activity, with no significant spikes during recent price movements. This balanced participation from both buyers and sellers contributes to the current consolidation phase.
Conclusion:
In conclusion, the MATIC/USDT pair is currently in a consolidative phase with a neutral to slightly bullish bias. The RSI indicates a neutral position, while the MACD suggests a potential for building bullish momentum. Traders should closely monitor the support levels at 0.5885 USD and the resistance levels at 0.9511 USD and 1.2900 USD. A break above the resistance levels would confirm a bullish trend continuation, while a failure to hold the support levels could lead to further declines.
Overall, the market sentiment for MATIC remains cautiously optimistic, with critical attention needed at the aforementioned levels and indicators to make informed trading decisions.

MATIC BULLS TO TAKE OVERHello Traders and everyone, I am Hadi Karaali, Known as SNIPERS_FX
If you like the idea, do not forget to support with a like and follow.
KCS BULLS PREPARATION. 📚
👉As we can see price is still sitting around a massive support zone, Where we are looking for new longs as we did before in our previous analysis attached on the chart.
👉The price is no longer establishing new lower lows; instead, it has begun forming higher lows. This shift signals a potential early indication for bullish momentum to take hold.
Moreover, to confirm this bullish signal, a break above the marked zone of major swing highs is required. Once this breakout occurs, a subsequent upward movement can be anticipated. 📚
If you like this kind of analysis don't forget to like and follow
and as usual follow your trading plan and manage your risk.
Be patient and good luck!

Polygon (MATIC) UpdateLooking at the MATICUSDT chart ( BINANCE:MATICUSDT ), it seems like the price might be getting ready for a breakout! Over the past few days, the price has been consolidating within a neutral channel, which could be a sign of potential built-up energy. If this happens, the price could break through the resistance line (the upper boundary of the channel) and head towards the higher levels within the upward price channel.
In simpler terms: MATIC's price has been holding steady recently, but it might be ready to make a move soon. There's a chance it could break out and climb higher!
Note: this is not financial advice, and it's always a good idea to do your own research before making any investment decisions.

Matic longMatics long term structure is really strong and I am confident we have hit the low on this correction.
The shorter timeframes are suggesting a possible partial decline of the latest range just below the historical resistance at 75c. There is also the three valleys patter that has developed and confirmed.
Here you typically wait for a break and confirmation of 75c, however we've decided to partly enter the trade now, with the plan of adding above 75c if we break and confirm it as support.
The stop loss is placed below the secondary low and at the break of the shorter trend. You could make your stop loss looser if you wanted to trade the range low. If we get stopped out we will look for the opportunity to re-enter.
For this cycle my long term targets are:
1. $2.61
2. $3.62
3. $4.50
These are the targets for my spot hold, I wouldn't want to see the price break 60c for this play.

NEAR LONGlimit buy in red zone
take profit upon reaching the price value according to the analysis on the chart

MATICUSDTMATICUSDT is in strong bullish trend.
As the market is consistently printing new HHs and HLs.
currently the market is retracing a bit after last HH, which is 38% Fib retracement level and local support as well. if the market successfully sustain this buying confluence the next leg up could go for new HH.
What you guys think of this idea?

Comprehensive Analysis of the MATIC/USDT Chart1. **Key Support and Resistance Levels**:
- **Resistance**: There are two major resistance zones on the chart:
- The first zone is around 2.500 to 3.000 USDT.
- The second zone is around 3.8740 USDT.
These areas are highlighted in red and indicate significant selling pressure where the price is likely to encounter resistance.
- **Support**: The major support zone is around the 0.500 to 1.000 USDT price level. This area is marked in green, indicating significant buying pressure where the price is likely to find support.
2. **Liquidity Levels (LIQ)**:
- **LIQ (weekly)**: Located around 0.0613 USDT, 0.2378 USDT, 0.3368 USDT, 1.6408 USDT, 1.9786 USDT, and 3.8740 USDT.
### Price Movement Prediction:
- **Upward Movement**:
- If the price can break through the resistance at 2.500 USDT, it may move towards the higher liquidity targets at 3.000 USDT and then 3.8740 USDT. These areas are indicated by blue lines and can be considered potential targets for upward movement.
- **Downward Movement**:
- If the price falls below the support at 1.000 USDT, it may decline towards the weekly LIQ levels at approximately 0.500 USDT, 0.3368 USDT, 0.2378 USDT, and 0.0613 USDT. These levels can be considered targets for downward movement.
Conclusion:
- For short-term traders, monitoring price movements around the key resistance and support zones is important. Traders can look for signs of price reversal in these areas.
- For long-term investors, focusing on liquidity levels and overall price movement predictions can aid in better decision-making. If major resistances are broken, a move towards higher liquidity targets is likely, and if key supports are broken, a move towards lower liquidity targets is likely.

Lingrid | MATICUSDT long from the KEY Support levelThe price perfectly fulfilled my previous idea. It reached the target level. BINANCE:MATICUSDT has made a significant bullish move, bouncing off the support level at 0.7000. The price has broken and closed above this key level, suggesting a potential upward momentum. On the daily chart, we see a strong bullish candle, which reinforces the possibility of a retest of the resistance level. Moreover, the market has broken out of the range zone and quickly retracted, creating a classic breakout-retest scenario. I anticipate the price to continue its upward movement, targeting the resistance level and the channel border. My goal is the resistance at 0.7780
Traders, if you like this idea or have your own opinion on this matter, write in the comments. I will be glad 👩💻

MATICUSDT: Next move can be upwards and towards! BINANCE:MATICUSDT price failed to fill the liquidity void area where luckily we have strong buying zone too. Price is likely to bounce back from this zone strongly and it is likely to continue the strong momentum. Like all crypto pairs we still expect price to bring more strong buying volume. Good Luck and Trade Safe.
Like our work? Then please like and comment our ideas which will encourage us to bring you more content. Thanks a lot.
Team SetupsFX_

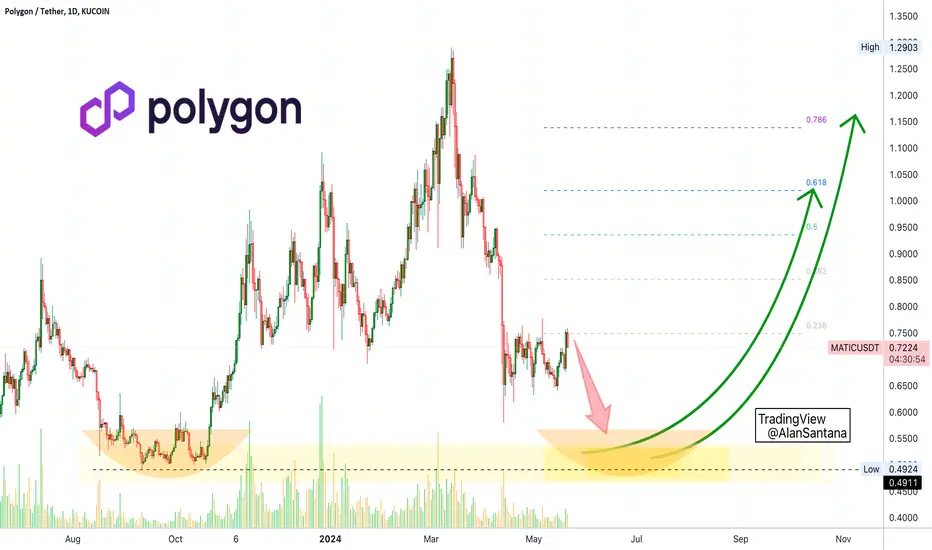
✴️ Polygon (MATIC) Lower Low 30% Drop Before Bullish WaveNotice how yesterday's session is not that strong—Polygon (MATICUSDT).
Notice how today we have red rather than green.
This level of weakness implies that a new low is likely coming in the following weeks and that is something that we have been expecting and welcome because there will be better opportunities when prices are low.
Imagine buying at the market bottom and enjoying GREEN/Up for the entire 2024/25 bull-market. As soon as you buy, prices grow.
👉 For this to be possible patience and experience is needed and of course, we have to wait for the correction bottom low.
Q: How do we know that the market is moving lower?
A: We do not know.
What we know is what the chart is saying now... The market has been moving down since 13-March and this down-move seems to be reaching its end, according to what the chart has to say.
👉 Remember, if you are a beginner, you can just hold and buy more once support is reached.
For beginners, the best course of action is "buy and hold." That is, buy and if somehow you made a mistake just wait and buy more each time prices drop. This is how I personally do it for long-term success and gains. This is not financial advice of course and you need to do your own research.
The reason why you need to do your own research is because of the risk; money can be lost. If you lose money, that is your responsibility because you did the clicking, you made the decision. Here we all share information freely yet we are all adults.
Keep in mind that the market can quickly reverse and move up rather than go down and I can be completely wrong, this happens all the time.
We are reading the charts and using our knowledge and experience to make predictions. Sometimes we simply translate what is written on the chart.
Sometimes we get it right, other times we get it wrong.
All the professional traders in the world will easily tell you that the true winners are not those that have a 90% success rate but rather those that have a winning strategy and those that know how to take a loss.
... More?
Leave a comment and I shall expand.
Thanks a lot for your continued support.
Namaste.
MATICUSDT IDEAHey traders hope you are enjoying our analysis. Now we are here again with a new trading opportunity. We will discuss today about MATIC
MATIC The Decending Channel Breakout has Already Done in 10H Time frame✍️
Also its on Support level
And Resting in process ✍️
Expecting 50% Bullish wave in Coming day's 🚀

$MATICUSDT-Channel Breakout Confirmed in Daily TimeframeDear Traders,
We are convening a discussion focused on #MATICUSDT
THE Decending Channel Breakout Has Already Done ✅
Also its on Support level,
So,I Expect a Bullish Move of 80% 🚀
Regards: AnnaTradeCharts
#Bitcoin #Crypto #Ethereum #Cryptocurrency #CryptoTrading #BTCUSDT #ETHUSDT #ALTCONS #USDT CRYPTOCAP:BTC CRYPTOCAP:ETH CRYPTOCAP:USDT CRYPTOCAP:PEPE CRYPTOCAP:DOGE NASDAQ:ALT

MATIC NETWORK FED WILL CAUSE BIG CRASHBlackrock CIO already mentioned hours ago that FED wil hike the rates.This is panicing themarkets..and it is just the beginning. Entries and Take profit levels see on chart above

Bullish on PolygonReason.
1. Monthly Flag Pattern & peanut pattern very easily identify
2. From 2021 Breakout so it's been a 3 years
3. ALT Season is bullish
4. W is making like HL & LH
You can enter now or you can wait till above close 1.32 & Above close candle for Entry
SL : if you enter at 1.32 is 1
Target i will update expected move 6000% Up. as pr past graph it could be 95$ but let's target with 5$ 1st and then we can do swing trade :)


#MATIC/USDT#MATIC
The price is moving in a head and shoulders pattern on the 4-hour frame and sticking to it well
We are now at the end of the formation of the right shoulder, and a rebound to the upside is expected
We have a tendency to stabilize above the Moving Average 100
We are oversold on the RSI indicator and we have a downtrend that is expected to break higher to support the rise
Entry price is 0.7300
The first goal is 0.800
The second goal is 0.860
The third goal is 0.9270

🔥 MATIC Massive Triangle: Accumulation Before Break OutMATIC has been trading inside this massive triangle for over 2 years at this point. Chances are that it will take another year before MATIC will finally break out of this pattern.
In my view, this triangle is a huge accumulation area where traders are loading in their bags in preparation for the next leg up.
This can really fly once we break out. Time will tell. Patience is key.

ADAUSDT scalp meHello Birdies,
Here is a scalp trade ADA has made a range and it need liquidity.
Listen carefully, if this trade go against you take the opposite trade. But that chance is slim.
Everything is on chart trade accordingly and trade safe.

MATICUSDT IDEAHello Trading view Family / Fellow Traders.
I hope you have used and benifited from the previous analysis .
In today trading session we are monitoring MATICUSDT for a buying opportunity,
MATICUSDT UPDATE
In 12H Timeframe, Bearish pennant Breakout is Done & Now ready for good bullish wave 💹
Maximum chance to gain +40% profit💸 in coming days 🚀🚀

signal for matic/usdt 2024-05-17 TF-15MFalling signal in Matic
Weakness in the trend and formation of twin roof pattern.
please check and follow

MATICUSD - Gaussian Channel Indicator ShiftA shift from the bearish red channel to the green bullish state is seen on this Weekly timeframe
Expecting incredible results from MATIC/Polygon.
Observational post.
Very bullish.

Alikze »» MATIC | Elliott Triangle pattern scenarioAccording to the previous analysis, the Metic currency went through an upward movement cycle. Currently, it is in a corner pattern in the weekly time, which was able to escape from it in the specified supply area with a short-term movement cycle.
💎 Currently, it has a corrective cycle up to the green box, which has moved downwards in a three-wave step in daily time.
💎 But now it can enter an upward cycle and retest the first supply area after confirming the green box. If confirmed, the area of upward movement can continue to extend to the base of the pattern, which can be checked further.
💎 Therefore, this upward movement can be followed in the form of wave 3 or 3 larger up to the specified areas.
💎 Alternative scenario: If the green box area is broken, this correction can be a combination correction that will have the ability to reach the 0.39 range.
»»»«««»»»«««»»»«««
Please support this idea with a LIKE and COMMENT if you find it useful and Click "Follow" on our profile if you'd like these trade ideas delivered straight to your email in the future.
Thanks for your continued support.
Sincerely.❤️
»»»«««»»»«««»»»«««
