MATIC IS READY FOR FIFTH ROUND OF BULLISH WAVEMATIC might have been completed 4th wave of downtrend inside triangle pattern. We need the price to stay above 0.52 level in order to be bullish. Soon it is expected to catch bullish momentum once BTC melting stops.
MATICUSDT trade ideas

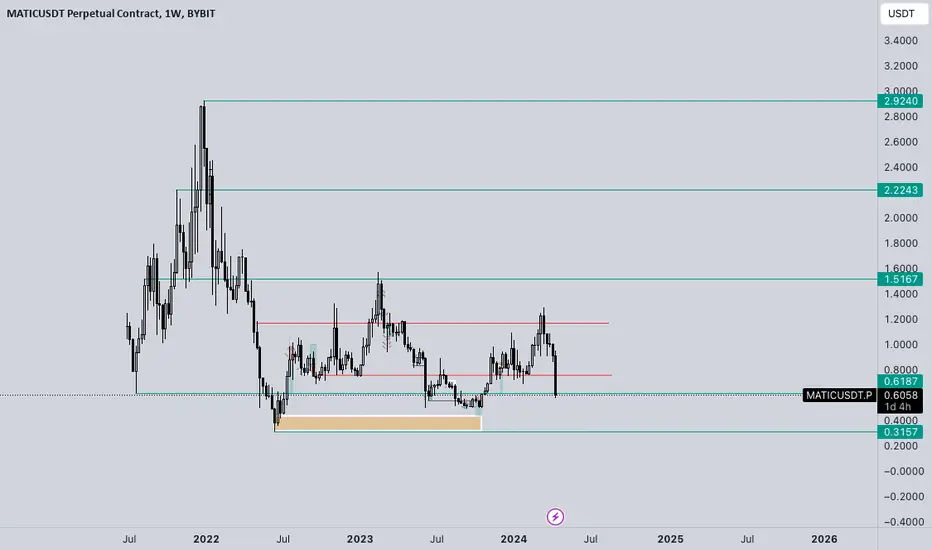
MATIC - Ranges overview We are currently trading below the lows of the HTF range (red lines) on MATIC.
Let's see IF BTC hold its lows and manages to hold the overall crypto market.
IF we fail to hold these levels on MATIC we should hunt the sellside liquidity resting around 0.4000$
IF we hold these levels expect us to aggressively run the buyside liquidity.
Don't try and FRONT RUN THE MARKET
LET THE MARKET SHOW YOU ITS HAND AND REACT TO IT
Stay safe and never risk more than 1-5% of your capital per trade. The following analysis is merely a price action based analysis and does not constitute financial advice in any form.
MATIC X2 PotentialMatic has been in the bull cycle from 2021 and so a correction this massive was expected. Good entry point is 0.5 as that is the resistance on the Day time frame using the Fibonacci sequence.


Just bought into MATIC during the dip for my long-term portfolioJust bought into Matic during the dip for my long-term spot portfolio. Excited to see where this gem takes us! 💎

Analyzing MATIC: Identifying Long-Term Entry Points at $0.75As a quantitative analyst and algorithmic trader, I am currently crafting a spot portfolio aimed at achieving over 100% profit in the crypto market.
My algorithmic trading approach operates within a cloud-based system featuring two distinct edges tailored to capture different market trends: the medium-term edge, situated closer to the current market price, and the long-term edge, positioned further away.
When the medium-term edge surpasses the long-term one, signaling an upward trend, the cloud indicator shifts to green. Conversely, if the medium-term trend falls below the long-term one, indicating a downward trend, the cloud transitions to yellow.
According to my personal strategy, targeting the sharp edges of the cloud presents favorable retracement opportunities, prompting me to become a long-term Metic buyer at these points.
Please be advised that any market analysis presented herein is solely for informational purposes and should not be interpreted as financial advice or a trading signal.

MATIC - A Beautiful Rising ABC Jumping Though The CreekCRYPTOCAP:MATIC
From the bottom we've watched a Wyckoff Accumulation jump the creek and stair step through a 5 Elliot's Wave and print a rising ABC flag, while coiling on support and showing a SOS at the LPS all while printing a large daily bullish OBV divergence.
Matic has always been a slingshot play, this lag in PA is exactly what was needed to shakeout the weak prior to vertical IMO

#maticusdtThis is my opinion regarding this currency, according to the failure of the long-term trend line and the existing support.
entry : /8066
tp1:1.8

MATIC long hereHi Im taking Matic here - monhtly deviation hasnt been confirmed (yet) thus smaller position and will cut fast if it goes against me...
fresh breakoutMatic has been stuck in a triangle since 2021. now in 2024 we have a FRESH breakout + retest.
check. and check.
Bullish if we can hold above triangle for the rest of the month.
Monthly candles have a very interesting higher low as well.

Matic Fractals : Range => Shakeout => PUMP !!!MATIC has been exhibiting a peculiar pattern on the daily timeframe. The price has been accumulating lows twice now, followed by a sharp shakeout of those lows (liquidity grab), which then triggers a pump. This article will focus on the idea that history repeats itself in the market and how we can capitalize on this by identifying these patterns.
The accumulation and shakeout:
MATIC formed clear patterns of accumulation. In both cases, the price consolidated within a range for a few days, creating a cluster of lows. This was followed by a sharp downward movement, shaking out weak hands and stop-loss orders, which is a common market manipulation tactic known as a "liquidity grab."
The pump:
After the shakeout, MATIC bulls stepped in and started buying, resulting in a strong bullish rally. In the first instance, the price rallied from $0.80 to $1.20, a 50% increase. In the second instance, the price rallied from $1.00 to $1.60, a 60% increase.
History repeats itself:
The saying "history repeats itself" is often used in the financial markets, and this is a perfect example. MATIC has shown us a clear pattern of accumulation, shakeout, and pump twice in the past. It is reasonable to expect that this pattern could repeat itself in the future.
The opportunity:
The current price of MATIC is sitting at a critical support level. If the price breaks down below this level, it could invalidate the bullish thesis. However, if the price holds and starts to accumulate lows again, we could see a similar bullish rally to the ones we have seen in the past.
The trade:
If you believe that history will repeat itself, you could enter a long trade on MATIC once the price confirms a breakout above the current resistance level. A stop-loss order could be placed below the support level to mitigate risk.
Conclusion:
The MATIC chart shows a bullish pattern. The price has been accumulating lows and shaking out weak hands. This has happened twice in the past, and both times it was followed by a strong bullish rally. If history repeats itself, we could see a similar rally in the near future. However, traders should always do their own research and manage their risk accordingly.

Polygon (MATICUSD): Time To Blow Expectations!Polygon (MATICUSD): BINANCE:MATICUSDT
For Matic, it is now assumed that we have developed the first Wave (a) around our 50% level at just under 90 cents. Now, we're working on developing Wave (b), which is currently at the 138% level and at the end of our resistance zone. This zone has been significant in several instances, holding up so far, and indications suggest it continues to hold. If we surpass this 138% level, it would imply that our limit order, or rather Wave ((ii)), has been reached, concluding this phase and entering Wave ((iii)). If this doesn't happen, we continue to expect a sell-off down to the 50% level, and at most to the 78.6% level.

MATIC/USDT assessing key support? 👀🚀Polygon analysis💎 Paradisers, pay close attention to #MATICUSDT. It’s currently displaying a promising sign of an upward trend, having recently broken above its descending trendline. This sets the stage for a potential bullish move
💎 Historically, #POLYGON has adhered to a descending channel pattern, consistently showing lower lows and lower highs. At present, it’s positioned at a crucial support level of $0.9296. If the price maintains its momentum here, we’re on the brink of a significant bullish surge.
💎 As prudent traders, we must be prepared for various outcomes. While a bullish rebound from a lower support level at $0.8335 remains a possibility, dipping below this level could trigger a marked bearish downturn.
💎 Keep your strategies versatile and your decisions well-informed, Ladies and Gentlemen of ParadiseClub. Your ParadiseTeam is diligently monitoring the market to navigate these opportunities effectively
MyCryptoParadise
iFeel the success🌴

#MATIC/USDT#MATIC
The price is moving in a downward channel on a 4-hour frame and we have a green support area at the 1.00 level
We have a higher stability moving average of 100
We have a good bounce being set up from the lower border of the channel
The RSI indicator has a downtrend that is about to break higher
Entry price 1.08
The first goal is 1.12
The second goal is 1.20
Third goal 1.29

MATIC ANALYSIS🔮 #MATIC Analysis - Breakout 🚀🚀
💲💲 There is a breakout of Falling Wedge Pattern in #MATIC and trying to retests the level. It's a 4 hr time frame breakout and we will see more higher price in short-term. A successful retest of support could propel a rally 📈📈
💸Current Price -- $0.9388
📈Target Price -- $1.2702
⁉️ What to do?
- We have marked crucial levels in the chart . We can trade according to the chart and make some profits. 🚀💸
#MATIC #Cryptocurrency #Breakout #DYOR

MATIC has broken above the Bearish channelMATIC has broken above the Bearish channel, it can continue to go up if BTC stays above 70K
🔵Entry Zone 0.9233 - 0.9443
🔴SL 0.8286
🟢TP1 1.0077
🟢TP2 1.0818
🟢TP3 1.2867
Risk Warning
Trading Forex, CFDs, Crypto, Futures, and Stocks involve a risk of loss. Please consider carefully if such trading is appropriate for you. Past performance is not indicative of future results.
If you liked our ideas, please support us with your likes 👍 and comments.

MATICUSDT IDEAHello Trading view Family / Fellow Traders.
I hope you have used and benifited from the previous analysis .
In today trading session we are monitoring MATICUSDT for a buying opportunity,
MATICUSDT UPDATE
Following our plan #Matic is ready for a good bullish wave after successful retest in this move we can see price around 2.5000💰 Soon 💯 ✅

MATICUSDT IDEAHey traders hope you are enjoying our analysis. Now we are here again with a new trading opportunity. We will discuss today about MATIC
MATIC Breaking Falling Wedge In case Of Successful Breakout Expecting Move Towards 1.30-1.35$ In Coming Weeks

#MATIC/USDT#MATIC
The price is moving in a downward channel on a 4-hour frame, about to break upward
The area in green is a very strong support area from which the price rebounded at 0.8500
We have a downtrend on the RSI indicator about to occur. The fraction is up
We have a higher stability moving average of 100
Entry price. 0.9105
The first target is 0.9635
The second goal is 1.019
the third goal is 1.085

Matic/Usdt Plan MATIC/USDT appears to be gearing up for a breakout on the 4-hour time frame. In the event of a successful breakout, we could potentially see a bullish rally of 30-40% in the short term. I anticipate this breakout to occur soon, but it is important to wait for confirmation before taking any trading actions. Please note that this is not financial advice, and it is always recommended to conduct your own research (DYOR) before making any investment decisions.

#MATIC/USDT is testing the Diagonal Trendline in 4-Hour TF!#MATIC/USDT is testing the Diagonal Trendline in 4-Hour TF!
CRYPTOCAP:MATIC is trying to breaks PML $0.909 resistance level. We needs a candle closing above this. Wait for trendline breakout and retest to long #MATICUSDT.

MATIC is getting ready for a significant move!Hi All,
Polygon (MATIC) is a significant blockchain project focused on Scalability and Efficiency . It enables faster, low-fee transactions within blockchain networks. As a top cryptocurrency, MATIC has recently undergone a healthy correction and is poised for a crucial move. Keep in mind that this coin requires a Mid or Longer time frame for substantial profits.
Currently, MATIC is forming a compelling triangle pattern after a substantial decline and correction. This compression suggests an imminent breakout, with a strong possibility of reaching a price target around $2.
Note: A well-timed move could even push and propel it to $3 or higher!
What do you think? has potential for 100% Profit you think? 🚀
Good luck! 🎯
Armin-Academy

MATIC Polygon Consolidation AreaFollowing MATIC's precise entry into the Buy Area:
At present, I anticipate trading within a range, awaiting price consolidation around $0.95 before witnessing another significant move.
