9/3/2022 NYSE (A)Short (Entry Price) within the sell zone area and exit (Stop Loss) above the red line. Can take profit at the suggested Target Price.
Entry Price: $129.09 / $131.68
Target Price: $126.42 / $129.81
Stop Loss: $133.55
1A trade ideas

Agilent Technologies, Inc bullish
Agilent Technologies, Inc. is an American analytical instrumentation development and manufacturing company that offers its products and services to markets worldwide.
set sl under the curve

Agilent Technologies bearishAgilent Technologies, Inc. is an American analytical instrumentation development and manufacturing company that offers its products and services to markets worldwide.
set sl above curve

Agilent Technologies, Inc bullishAgilent Technologies, Inc. is an American analytical instrumentation development and manufacturing company that offers its products and services to markets worldwide.
LONG AI originally found this stock through a FINVIZ screener. Both fundamental and technical analysis leads me to the conclusion that this is a great stock to buy
FA:
-Their income statement and balance sheet for the past few years has been trending upwards which is a great indicator of success to come.
-Their sector is in health tech and currently have a market cap around 42B.
-Their current ratio is 2.2 which is really good. this means they have 2x the assets to pay for their current liabilities.
-Their Debt radio is 49% which is amazing. Mean if they need loans they will be able to pay for them because their Assets double their liabilities
TA:
-RSI is extremely low and in the oversold territory, this presents a massive upward possibility
-MACD is very low and also presents a massive upward possibility
-SRSI is also extremely low, once it passes the 20 mark would be a great time to enter the trade and can be taken as a sign that the stock will reverse its current downtrend.
-Currently in an box right where there was support found last time price was here
There is 0 reason I found on FA for this stock to be trending downwards. This looks like a healthy market correction and should be seen as a fire sale.
Since the stock has had a large correction now would be the perfect entry for a long term position. This is an S&P 500 stock not a fad, so its great to build a long term position in and especially at its discount price

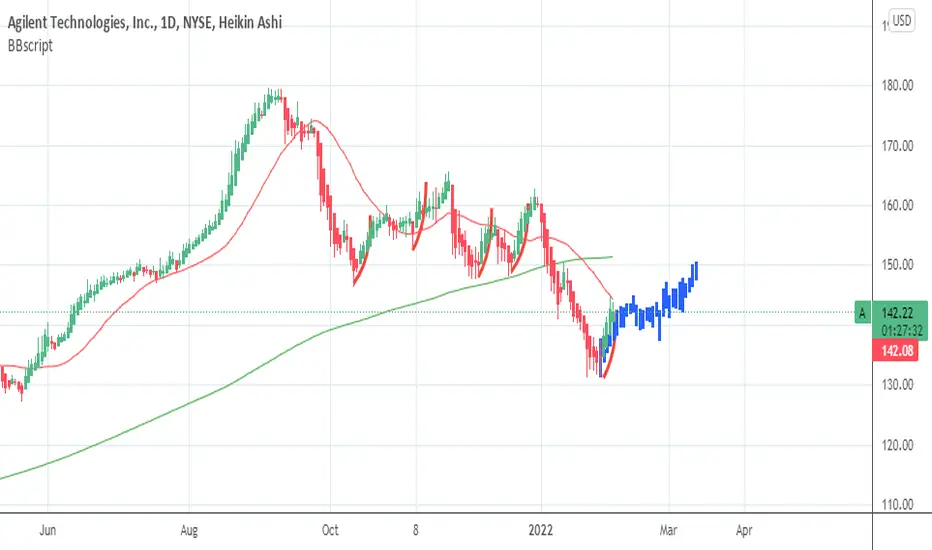
Be SafeThis is a weekly chart.
So far, this security is not having a drastic drop daily like many others are, but I am sill not going there; like labeling things, securities, as parabolic because the second I do they break to the upside.
So this is just a "keep my eye on it"
There are certain securities I keep my eyes on and this is one of them. Not buying here as it still looks too steep for me. I guess I had no clue it would get to this high early on and sold too soon. It happens, I suppose, to all of us.
It happens, yet we do not always forget and I have been following this in amazement since it surpassed my target to the upside
and now it has started dropping.
So I set alerts all the way down and hope that I find it when I see a buy signal. I have not yet. You may. Still too steep for me )o:
We are all different. No recommendation.
Short percent is 5.45%/Negative volume remains high. NVI can represent big money and is similar to OBV. NVI is volume on down days. Sometimes even those folks finally give up )'
The 1 minute time frame can show you where those folks give up and buy at a certain level. Even big money has a breaking point. It is just usually lower than ours is. And that is most often how they win.
The investors I reference have many more years to wait that I, or maybe you do. For some, they buy at the bottom and realize they are doing their job an will no longer be here in years to come. There are folks out there who have more time on earth than I do. That is something to consider for sure in this game. Knowing what type of trader you are and what your time frame is are paramount.
And your rules you made when you started trading or investing. Those are the most important statements of all.
For me:
****Lessons learned: Buying a security to make your money back that you lost the first time around is usually not a good idea. Just because I like the security does not mean it will go up at that particular time. I have to watch the rotation. A time limit, or a bottom pattern works best for me but we are all different.
***Do not set my stop loss too close if I want to hang. 2 X ATR will keep me safe enough for my IRA. I am more cautious with my individual account/Go figure?. If I do not want to be sure I hang, set it a bit below the nearest support. When I set it below closest support, they find me eventually and I do not get to hang. I stopped doing this after lesson learned. I suppose everyone else had their stop there as well. Dunno.
1. Knowing Why I am buying this security (or why not), What is motivating me?
2. What is my exit strategy? Many times being time, but many use price. If a security does not move in 5 days and I see no chance, let go. This can also be a stop loss where I feel it is a doomer and I lost that round. No biggy because there are plenty more to choose from. Every now and then this stop loss is not hit and I am happy it was not hit. But I know it is there. As a rule I do not enter stop losses and hope that I catch it or know better before hand. This is not a good practice, especially on a high risk security in this particular market which is volatile. It does depend on what I am holding these days. IE XLU, MSFT, CMCSA or VZ etc I will hang on for now. I plan to buy AAPL back when it is down a quite a bit. (Slowly buying back TTD presently and QCOM as well when things settle) I am not in the mood to worry right now (o:
3. How much, considering what is motivating me, am I willing to risk on this particular security? Did I look for overbought conditions before I bought this?
4. Another stop loss which is a price I will sell at which is not the same as number 2. Number 3 means I did win or did not win and is usually determined later. It can be a trailing stop. This can mean even if I did not get the max total but I am see I will lose money I have made very soon. Or it can mean I just flat out picked a loser and it is time to let go. These are both risk management. There is no way to telepathically know this. Only rules can help most people with this. After a while you can either feel this or not so rules are probably best for most. Buying in increments can also help. And you will be right, or wrong some of the time. I have learned not to sweat it too much! Sometimes getting out of the market with a profit is better than sitting back and taking a loss. This is one reason I have learned to keep my holdings smaller so I can watch earnings and charts. It is just easier for me to keep up with 10 versus 20.
5. Look for patterns or whatever it is you follow on hourly, daily, weekly, and monthly. Maybe look at lower time frames when getting in and higher time frames for staying in. A 20 year maximum monthly confirmed uptrend that does not look like the stairway to heaven is less likely to screw me over. I hope. But always remember it can!
A bottom is not always the bottom. You may think it is dirt cheap, but even dirt can get cheaper! PE 30.01 EPS 4.84 MKT Cap 44 B
Agilent Technologies, Inc. provides application focused solutions to the life sciences, diagnostics, and applied chemical markets worldwide. The Life Sciences and Applied Markets segment offers liquid chromatography systems and components; liquid chromatography mass spectrometry systems; gas chromatography systems and components; gas chromatography mass spectrometry systems; inductively coupled plasma mass spectrometry instruments; atomic absorption instruments; microwave plasma-atomic emission spectrometry instruments; inductively coupled plasma optical emission spectrometry instruments; raman spectroscopy; cell analysis plate based assays; flow cytometer; real-time cell analyzer; cell imaging systems; microplate reader; laboratory software; information management and analytics; laboratory automation and robotic systems; dissolution testing; vacuum pumps, and measurement technologies. The Diagnostics and Genomics segment provides arrays for DNA mutation detection, genotyping, gene copy number determination, identification of gene rearrangements, DNA methylation profiling, gene expression profiling, next generation sequencing, target enrichment and genetic data management, and interpretation support software; and produces synthesized oligonucleotide. It also offers immunohistochemistry in situ hybridization, and hematoxylin and eosin staining and special staining; consumables, and software for quality control analysis of nucleic acid samples; and reagents for use in turbidimetry and flow cytometry, as well as develops liquid-based pharmacodiagnostics. The Agilent CrossLab segment provides GC and LC columns, sample preparation products, custom chemistries, and laboratory instrument supplies; and startup, operational, training, compliance support, software as a service, asset management, and consultation services. The company markets its products through direct sales, distributors, resellers, manufacturer's representatives, and electronic commerce. Agilent Technologies, Inc. was incorporated in 1999 and is headquartered in Santa Clara, California.

Agilent $AAgilent $A just broke out of the wedge. Lets see if it will retest and bounce or break back into the wedge.

Agilent Long Chance on Moving AveragesAgilent just touched the MA200 and EMA200.
NYSE:A could bounce back to the previous high or maybe to the all-time high.
weekly chart: Long trend
monthly chart: Long trend
if Agilent continues the downtrend under the MA200 and EMA200, close position

$A god move coming~After the amazing impulsive move to an ATH we came back to the 61 fib line which is a great pullback and a healthy one.
~we are in a wedge rn and are looking at a breakout next week
~~Bull flag highlighted in white looking hella fine, hinting at a breakout happening for the bulls
~Red zone is SL
~Green zone is take Profit max
~white zones in between will be key resistance points.
~VI indicator shows momentum is about to turn back to bullish. With earnings coming up on the 22nd, this could be a run-up to earnings play

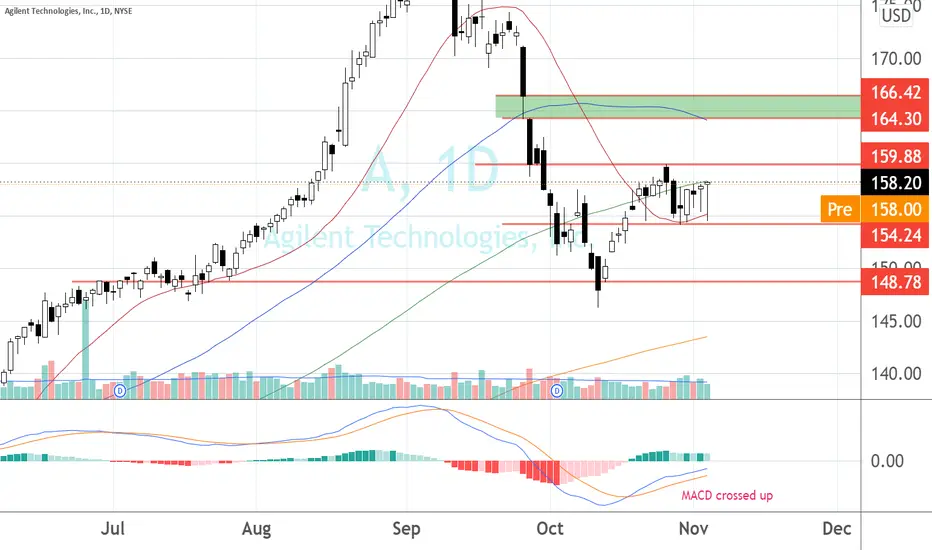
Pending for Breakout soon?been consolidate within $154-$159.88
pending for BO.
Plan A
EP when price break above 160, with target at 164-160.
Plan B
EP with SL below $154.
Target at $164-166
Time for A to go D(own)You like my clever title? Zoom out on this chart and you will see this stock has almost doubled in a matter of months. Monthly RSI is 90, daily RSI is about the same, this thing is ready to crack, and crack it will. It looks like we just backtested the most recent rising wedge trajectory, usually a fall is the next step. Do yourself a favor and consider puts at least several weeks out, then enjoy the free money that results. Short at will.
Do your own DD, I have no idea what I'm doing.

$AAgilent is a leader in life sciences, diagnostics and applied chemical markets. The company provides laboratories worldwide with instruments, services, consumables, applications and expertise, enabling customers to gain the insights they seek. Agilent's expertise and trusted collaboration give them the highest confidence in our solutions.
Agilent focuses its expertise on six key markets:
Food
Environmental and Forensics
Pharmaceutical
Diagnostics
Chemical and Energy
& Research
It’s no doubt, this company has seen incredible growth seeing over 200% since the COVID lows.
But in my honest opinion, the valuation is ridiculous.
Agilent Technologies is starting to look like a “Parabolic Curve Step-like Formation” on the monthly timeframe w/ the
RSI ridiculously oversold.
- 5.90 on the daily.
- 10.96 on the weekly.
- 90.00 0n the monthly.
MACD overstretched.
- 5.90 on the daily
- 10.96 on the weekly
- 20.98 on the monthly
I suggest keeping this on your watchlist.
- Factor Four

Wow, That's Overbought.Good morning everyone! From now on, every Thursday morning we will be highlighting our favorite trade setup of the week. This week, we will be taking a look at a short setup in A.
Agilent Technologies makes lab equipment for life sciences and chemical companies, which is a stable and growing market. The company does a lot in revenue - roughly 6 Billion over the last twelve months - and it makes solid net income margins in the mid teens. Growth is slow but stable. Over the last twelve months, demand for the company's products increased as a result of the COVID pandemic, and resulting demand bump for biotech equipment. Because of this, the company saw it's highest period of growth in the last decade with a 17% bump in revenue. The company is well run, and that top line growth will drop straight to the bottom line in the form of increased earnings.
As a result of this business catalyst, and the bump in performance, the stock, since COVID lows, has rallied nearly 200% to it's current price around $173 per share.
We are looking to short this move.
This is because the stock, on a multiple basis, has re-rated as though it will experience a higher level of growth for the long term. The valuation is incredibly stretched at a 50x FWD P/E, which constitutes a nearly 35% increase to A's long term average multiple. Given that the company will, operationally, likely mean revert to a lower rate of long term growth, this multiple expansion basically constitutes "peak sentiment", in our view. Not to mention that the stock is also one of the most technically overbought names in the entire market, at a 89 RSI and 60 ADX.
"The trend is your friend till the end". We believe that the end is near, and the stock is a short.
Cheers!

A - Seems like an opportunitiy According to Traders-Paradise Algorithm, this has a high chance of going down as the TakeProfit & StopLoss strategy indicate.

Is Roche/RHHBY an under-performing stock? Is Agilent overpriced?these four are signficant players in the genome sequencing market, but RHHB stock price hasn't take off in the same way, and Agilent is way out in front.
Does this make RHHB a good buy, or, is there something wrong, and making the others a better prospect? Is Agilent a sell?


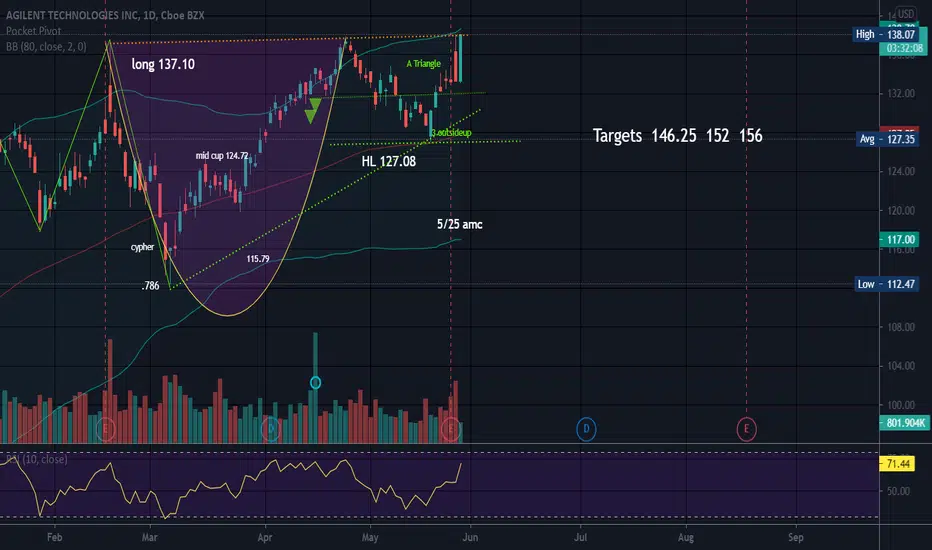
Cup and Handle Ascending TrianglePossible stop under handle low or last pocket pivot. Earnings were yesterday.
A is appears to have formed a cup and handle pattern and price is inside an ascending triangle. The top trendline of an ascending triangle is resistance, the bottom is support. In theory an ascending triangle breaks to the upside but as with any triangle, the pattern is neutral until a trendline is broken.
3 outside up is a bullish candle pattern and consists of 3 candles. It begins with a red candle when price is trending downward followed by a green candle that opens below the red candle and closes over the top of the red candle (bullish engulfing candle). The 3rd candle is a green candle and price closes higher once again. I have noted this pattern works well and does signal a short term price change to the upside. There is also a 3 outside down candle pattern which in theory is bearish.
No recommendation.
Agilent Technologies, Inc. provides application focused solutions to the life sciences, diagnostics, and applied chemical markets worldwide. The Life Sciences and Applied Markets segment offers liquid and gas chromatography systems and components; liquid and gas chromatography mass spectrometry systems; inductively coupled plasma mass and optical emission spectrometry instruments; atomic absorption instruments; microwave plasma-atomic emission spectrometry instruments; raman spectroscopy; cell analysis plate based assays; flow cytometer; real-time cell analyzer; cell imaging systems; microplate readers; laboratory software, information management, and analytics; laboratory automation and robotic systems; dissolution testing; vacuum pumps; and measurement technologies. The Diagnostics and Genomics segment provides arrays for DNA mutation detection, genotyping, gene copy number determination, identification of gene rearrangements, DNA methylation profiling, and gene expression profiling, as well as sequencing target enrichment, genetic data management, and interpretation support software; and equipment to produce synthesized oligonucleotide. It also offers immunohistochemistry, in situ hybridization, and hematoxylin and eosin staining and special staining; instruments, consumables, and software for quality control analysis of nucleic acid samples; and reagents for use in turbidimetry and flow cytometry, as well as develops pharmacodiagnostics. The Agilent CrossLab segment provides GC and LC columns, sample preparation products, custom chemistries, and laboratory instrument supplies; and startup, operational, training, compliance support, software as a service, asset management, and consultation services. The company markets its products through direct sales, distributors, resellers, manufacturer's representatives, and electronic commerce. It has collaboration agreement with SGS AXYS. The company was incorporated in 1999 and is headquartered in Santa Clara, California.
Short bias development on A. This one took me only 20 minutes. Getting quicker...! Doesn't mean it's right, but I'm getting through the steps. Patience +1. Money +1? TBD.
It's also very possible that we just had a leg out of a flag pattern and now everything I said will be totally wrong. Wouldn't be the first time. But, this is way more interesting than just using indicators.


A, TIME TO BUY?Hello fellow traders and investors, here's another trade idea.
A has recently pulled back to the trendline that acts as a support. If A makes a full recovery it offers around a 10% ROI to the previous high.
Technicals:
The Macd indicates that A is oversold
The Ema's indicate that A is in an uptrend
Price action indicates that it's still making lower lows and lower highs.
When To Buy:
When the Macd indicates a reversal by crossing its EMA
When To Sell:
At its previous high which offers a 10% ROI or hold for the longer term.
Fundamentals: Agilent Technologies, Inc. engages in the provision of application-focused solutions for life sciences, diagnostics, and applied chemical markets. Improving the quality of life with their products. Their growth looks decent, they do have some debt and insiders have been selling stock.
Rating: 30/100
I rate this company30/100 since insiders are selling shares we must ask ourselves why are they less confident about their company, another reason why I don't like this trade idea is that it's in the healthcare industry and if you've been following me then you know I don't trade any companies relating to healthcare and finally a 10% ROI for such a risky investment in my opinion just isn't worth it. If this trade idea meets your criteria feel free to add it to your watchlist.
NOTE: I will most likely be buying LOGI lightly on Monday and if EMA's cross I will add to my position.
I hope you enjoyed this quick analysis and many more to come.
If you enjoyed leave a like, follow and comment your thoughts.
Thanks.

cool down before the next leg up? its possibleamazing trend here for A ! broke top trendline resistance and really started flying lately. I think we will see previous top trendline resistance tested and we should see it act as support, remember resistance turns into support most the time in a bullish market!. so look for a dip entry at 105 then we can 135 and higher! goodluck team

