APPLE STOCK LEVELS DAILY CANDLE BASISAPPLE stocks as per fibonacci character will fill the gap at 192 levels in short term same time keep Stop loss at 180 levels @ daily candle closing basis
1AAPL trade ideas

AAPL AnalysisPrice consolidated since my last analysis, slowly inching towards the target of fair value gap at 190.08. No changes to my original expectations, I'm expecting a bullish move given that earnings call is near and we tend to see AAPL with bullish moves prior to the release.

Apple Stock Investment Analysis (Jan 15, 2024)Investing in Apple (AAPL) at $185 with a stop-loss at $165 could be a calculated gamble based on recent news and current market conditions. Here's a breakdown:
Reasons for Potential Growth:
Increased AR/VR Focus: Apple's recent investments in augmented reality (AR) and virtual reality (VR) suggest potential breakthroughs in these rapidly growing markets. The upcoming AR/VR headset launch could boost the stock.
Strong Brand Performance: Apple remains a premium brand with loyal customers, consistently leading in smartphone and wearables markets. This brand strength offers some stability during market fluctuations.
Shareholder-Friendly Practices: Apple regularly buys back its own shares, boosting stock price by reducing supply. This practice, along with consistent dividends, incentivizes long-term holding.
Potential Risks:
Macroeconomic Uncertainties: Global economic concerns and inflation could dampen consumer spending, impacting Apple's hardware sales.
Supply Chain Issues: Ongoing disruptions in chip production and global logistics could affect Apple's production and delivery schedules, impacting revenue.
Competition: Strong competition from companies like Samsung and Huawei continues, potentially impacting market share and profitability.
Conclusion:
Investing in AAPL at $185 involves moderate risk with potentially high rewards. Consider this a long-term play with significant upsides if Apple's AR/VR ventures bear fruit. However, be prepared for potential losses due to external factors and intense competition. Diversifying your portfolio and setting a tight stop-loss can mitigate risks.
Remember, this analysis is for informational purposes only and shouldn't be considered financial advice. Do your own research and consult a financial advisor before making investment decisions.

Apple has trapped buyers ?See the green UMVD which is now turning purple, that means divergence - Now we are below RED TrapZone and if we get RED UMVD now AFTER DIVERGENCE - We will start selling further Down.

APPL-BUY strategy Daily chartThe share is on its way up again, as the stochastic is positive and we have started corrective patterns now.
Strategy BUY @ $ 182-185 and take profit @ 193.00. SL below $ 178 for now.


AAPL Weekly Harmonic Elliott Wave and Hurst's Cyclic AnalysisReview:
The highlights of the previous update (Jan 6th):
Wave b of 5 of (A) completed as a triple zigzag.
Next is the last leg to the upside before a multi-month correction starts (wave (B)).
80D trough on Friday.
20D trough on 22nd or 23rd January.
40D trough 7-9th February.
20W trough in the last 2 weeks of March.
Major warning/bearish signs on the cyclic analysis of AAPL.
Update:
No change to our previous statements is needed.
Analysis of the Structure:
We have completed waves (I) and (II) of c of 5 of (A), now we are in wave (III) of c.
Analysis of the Cycles:
We are in the second 5D cycle of the first 10D cycle of the first 20D cycle of the first 40D cycle of the second 80D cycle of the 20W cycle.
10D FLD upside target is 188.73, which should be achieved on Tuesday.
10D trough expected on January 17th.
20D trough expected on January 25th or 26th.
40D trough expected 12-14th February.
20W trough expected on March 11th.


Apple, AAPL - Follow the Money, as in the MFIThis is the lowest MFI in over a year and yet the price has not fully moved to match the exodus of money flow. My expectation as shown is $172.30 in the near term and then another assessment should be done. 99% of the time price follows the MFI. Notice how as apple was making new highs 3 weeks ago there was a negative divergence on the MFI; Dec.18 was the optimum time to sell.

AAPL Bearish AAPL Bearish @ Daily TF
Story: Printing Bearish Trend and a Bearish Divergence
Anticipation: Can continue making new LH & LL since bearish divergence was formed
Plan: Sell Stop at .382 Fibonacci level of last LH to LL while riding Dow's Trend

Diamond on $AAPL at an elliot wave inflexion point?Firstly, I believe that AAPL, much like SPX, is setting itself up for a Wave 4 correction.
A few points on this.
In principle, because my count includes a relatively simple zig-zag for SubW2, we should have something different such as I mention to comply with the principle of elliot wave alternation.
This could be a triangle pattern or a flat correction for instance.
We can see that there is a significant multi-year divergence in place and I believe this to be a possible confirmatory signal. In fact, it seems to me that AAPL never recovered it's RSI from the end of the tech bubble.
So, one of the divergences is 2 decades long.
The most important one however has been in place since 2020.
This is still significant.
RSI divergences are seen as confirmatory signals for the end of moves because Wave 5's are supposed to end with divergences.
That is, the final subwave 5 of a move should print a lower RSI reading than the subwave 3 on any given timeframe.
As you can see there are quite a few divergences in place on the 2W chart.
My view, although I have no short position yet, is that these divergences could be setting up an end to the bull-run for AAPL (at least until a recovery emerges) and interestingly, they coincide with readings on other stocks and indices.
If we zoom in down to daily we can see that there is a significant wedge pattern forming off the 2022 selloff alongside a nasty 7 year RSI divergence.
Drilling-down further displays a diamond pattern and an upside gap roughly at the level 192 and there is a clear RSI divergence that led to the recent selloff.
I think that even if you don't believe a multi-year bear market may be on the cards, that the weight of evidence definitely suggests that AAPL is going to risk off in the near future and implies caution more than anything else.
You can ask of course, what AAPL has to do to invalidate this outline.
Well, that's the problem.
Even if AAPL makes new highs, it would not necessarily violate every aspect of this outline because there are factors in-play on multiple timeframes.
That is to say, even if the diamond is invalidated (which would require new highs), it does not necessarily invalidate the broader long-term outline or any of the substantial divergences.
In fact if we look at the wedge on 4h, that does say that there is some room to grind higher (but the wedge does not specifically demand this to fulfil that part of the outline).
However... the time to discovering what actually happens is only a few months (I consider Spring to be real moment-of-truth).
So although there might be some upside to this (Say, to the 200 level) that does not necessarily invalidate any part of the outline, the actual time involved in that upside is not a particularly long timeframe.
So even if the diamond only leads to a short selloff (or is outright invalidated), and the price resumes it's bull trend then, the wedge suggests that this could only be for a few months.
And of course none of the invalidates the overall wave count or the significant divergences in place.
So even if the short-term bear outline is wrong, the longer-term one may not necessarily be.
That is why I consider this outline to be compelling and why, even if you aren't looking to short it, that it could be a poor long investment going forwards and if I was an AAPL holder (I haven't owned AAPL since about 2015), I would wait for it to clear-out these outlines before I was prepared to jump back in.

2 possibilitiesLong by next week, short tomorrow.
Also could be just long tomorrow.
Just my analysis.
Sorry if the chart is noisy/hard to follow. Tried to fit a lot of analysis into a single chart image.
Two Possibilities in my opinion:
1. The H&S pattern completes and we retrace down to 180.5-179.70 zone.
This could fill the gap from last Fridays close to Mondays opening.
There's then a possibility that we form a double bottom using the 180.5-179.70 zone as the bottom.
2. We reject at the neckline or Yellow lower trendline and continue
in the channel to the red resistance trendline. In which case,
we're forming an ascending triangle

🐔 Apple Stock Movement:A Bullish Journey from $120 to $200 ?🤷 📊 📊 📈 📉
📎Investors and enthusiasts closely tracking the movements of Apple Inc. (AAPL) have been in for an exciting ride recently. The tech giant's stock has been making headlines as it shows signs of a bullish trend, with expectations that it will climb from its current level around $120 to potentially surpass the $200 mark. In this article, we'll explore the factors driving this upward movement and analyze the potential implications for investors.
📎Current Scenario:
As of the latest market updates, Apple's stock is trading around $180+/- per share. Analysts and market experts have been observing various indicators that suggest a positive shift in the stock's trajectory. Several factors contribute to this optimism, paving the way for a potential rally.
1. **Strong Earnings Reports:**✏️
Apple consistently delivers impressive quarterly earnings reports, showcasing the company's robust financial health. Positive earnings can significantly influence investor sentiment and contribute to an upward movement in the stock price.
2. **Product Innovation and Demand:**✏️
Apple is known for its innovative products that capture consumer interest. The recent launches of new iPhone models, updated iPads, and other products have generated excitement among consumers, potentially leading to increased sales and revenue.
3. **Services and Subscription Revenue:**✏️
Apple's services segment, including the App Store, Apple Music, and iCloud, has been a key driver of revenue growth. The recurring nature of subscription-based services provides a stable income stream, which can positively impact the stock valuation.
4. **Global Market Expansion:**✏️
Apple's presence in international markets, particularly in emerging economies, is expanding. As the company taps into new markets and reaches a wider customer base, it has the potential to experience increased sales and revenue, driving the stock price upward.
📎Anticipated Movement:
Analysts and experts in the financial markets are anticipating a gradual uptrend in Apple's stock price. The $120 level is seen as a crucial support, and as the stock gains momentum, it is expected to breach this level and move towards the $200 mark.
1. **Technical Analysis:**✏️
Chart patterns and technical indicators are being closely monitored by traders. If the stock can break through key resistance levels, it may signal a strong bullish trend, attracting more investors and driving the price higher.
2. **Market Sentiment:**✏️
Positive sentiment among investors, fueled by strong fundamentals and positive news surrounding the company, can contribute to sustained buying interest. Market sentiment often plays a crucial role in determining stock movements.
3. **Macro-Economic Factors:**✏️
External factors, such as macro-economic trends and global market conditions, can influence the movement of individual stocks. A stable economic environment and favorable conditions can provide tailwinds for Apple's stock.
Conclusion:
The movement of Apple's stock from $120 to potentially crossing the $200 threshold reflects the confidence investors have in the company's growth prospects. As Apple continues to innovate, expand its product offerings, and capitalize on the strength of its ecosystem, the stock is poised for an upward trajectory. However, it's important for investors to conduct thorough research and consider potential risks before making any investment decisions. The stock market is inherently unpredictable, and external factors can impact stock prices, so staying informed and vigilant is key for navigating these dynamic markets.📉
❌ ⭕️I'm not suggesting you should buy or sell. This is just my personal view: In the short term, it would be preferable to see a decrease before expecting an increase.❗️ ❕❗️ ❕

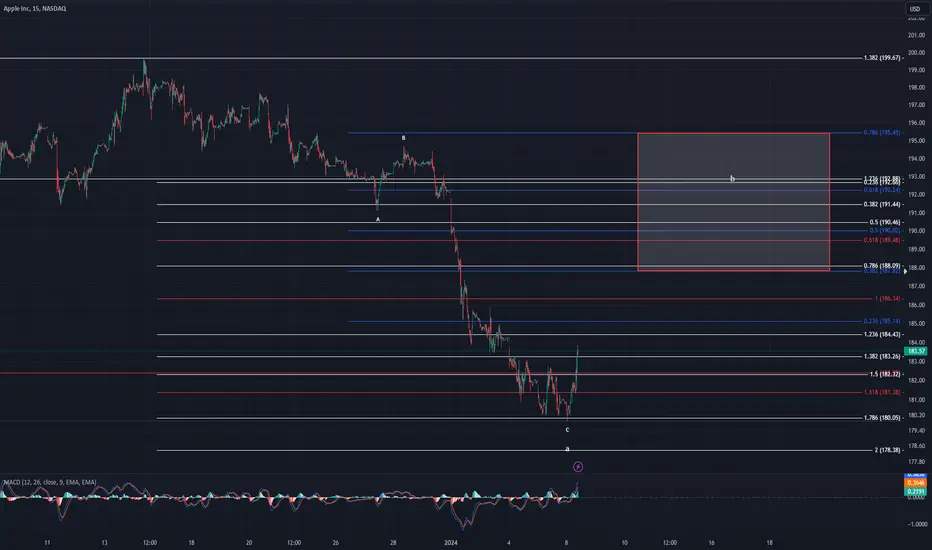
AAPLE Update: Following me path thus farIn my last post I alluded to the fact that Apple had in fact topped and we were starting our trek to the downside. I mentioned that we should hit the 1.618 area and then bounce for our next b wave. Well, we dipped one fib lower and tagged the 1.786 before we started to retrace higher. On the chart I have labeled the next target area to conclude this b wave before dropping again for another c wave. This will just keep sub-dividing more and more as this is, IMHO, a super cycle wave (II) event that will last years if not decades.
I would like to see this raise to at least the blue 0.618 but that is not a requirement. The most important thing is to track the structure. This move up should be a 3-wave move into my box (mini abc). Right now, price action appears to still be in its mini a wave. MACD seems to support this as well. The next move after we finish this retrace higher will be strong to the downside so make sure if you're trying to go long in this thing (ill advised) then use stops to protect your assets.
AAPL created bullish divergenceAAPL has created a bullish divergence on the 1 hourly chart. The trend seems to have reversed from bearish to bullish. Buying at this level and placing the stop loss below previous higher low.

2024 Horse Race - BestI surveyed 12 people to determine what they thought were the stocks that were most likely to perform best in 2024. This chart puts them head to head. The winner is the biggest gainer.

Mag 7 combined ChartHopefully this comes up correctly. I made a Mag 7 chart so ignore the price. Just using the weekly to estimate direction on day trades. Kind of best indicator I've used so far in this stupid moment we are in. I think we missed my 23% line, and may have broke the shorts too soon. I think it wants to revisit that line, accumulate and then go forever. Being that volume, Adv/Decl, nothing works right now, everything is divergent, fake outs, and trashy, I think we're in for a very interesting next few weeks. But I also think we could be at 8k+ by july after this trough, so... ya know.

SHORT | AAPL NASDAQ:AAPL
TP1: 182.94$
TP2: 177$
EMA Lines: The price has recently crossed below both the EMA9 and EMA20, which are often used as short-term and medium-term trend indicators, respectively. This could be a bearish signal suggesting that the price may continue to decline.
Support Levels: There are target prices marked on the chart, with Target Price 1 at $181.42 and Target Price 2 at $177.57. These may represent technical support levels, where the price might find a floor and potentially bounce back if the downward trend continues.
Trend Lines: There's a long-term upward trend line that the price has not yet reached, which could act as a major support level in the future.
Bollinger Bands: The price is approaching the lower Bollinger Band, which sometimes is interpreted as the stock being oversold. Some traders might expect a rebound off this level, while others may wait for confirmation of a reversal.
Relative Strength Index (RSI): The RSI is below 40 and is heading towards the oversold territory, which is considered to be below 30. This suggests that there may be a potential for the stock to become oversold, indicating a possible buying opportunity if other conditions are favorable.
Price Action: The latest candles show a bearish trend with the price decreasing. The large red candlesticks indicate strong selling pressure.

APPL similar setup to last time 🔭🍏We do have ER end of week that could invalidate this pattern, but it looks very similar.👀
ER run up to upside targets 175-182 can come before ER if market gets bullish
I was bullish on recent NFLX-Coca-Cola but I am not confident enough that APPL will beat to long and hold through earnings.
The headphones they release are extremely overpriced, buying a new iPhone makes 0 sense to me unless I break mine which is rare.. but I guess they a big fan base that will buy the new Iphone15 no matter what.
The biggest concern for me is that China has banned its use of iPhones for central government officials, so is that the start of a bigger ban? will they mention these concerns in ER call which will lead to a big dump in apple and SPY?
just typing out my thoughts, lets see what happens! boost and follow for more 💜

aapl 2 scenariosaapl 2 scenarios .. 1] buy after the break above the resistance level .... . 2] sell after the break under the support level

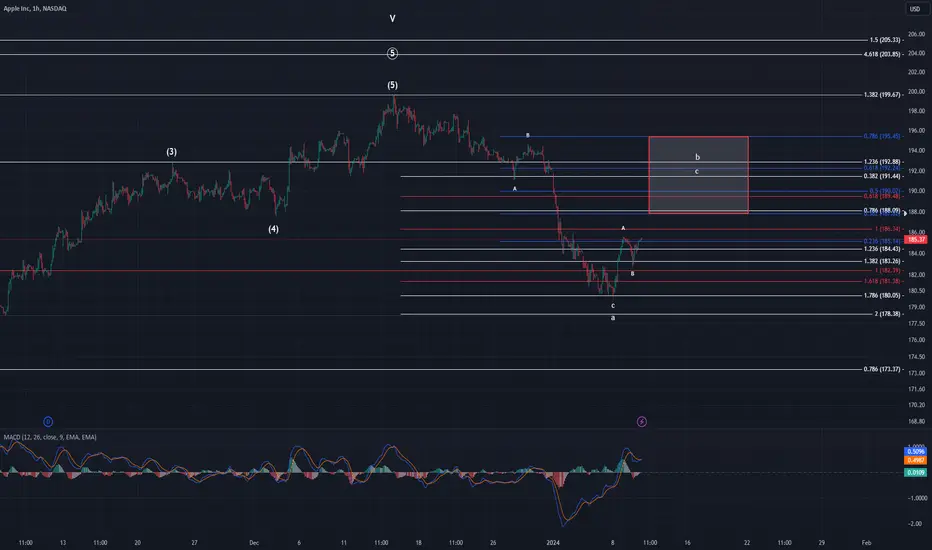
AAPL UpdateJust wanted to update everyone on the moves AAPL has been making lately. It is still following my path drawn out for it. If it is to remain standard, then I want to see it tag my target box drawn. As you can see on the chart, there is a decent amount of fib confluence around the $192 area which is where I think this move is likely to end.
Once we begin to drop for wave c, I expect that to take us to the $160's-$170's. Until we have a full b wave carved out though I can't be for certain. The higher b goes the higher c will end. That c will just be the last sub-division in a larger A wave. As with other corrective structures this thing is going to be sub-dividing for a while. If this is in fact the beginning of Super Cycle wave (II) as I am calling for....get used to the choppiness. This is the type of structure/price action you will have to trade for the next couple decades IMHO. As my mentor has said before, "This isn't your dad's or even your gpa's market". This is most like your great great gpa's market and most alive today have never even seen it let alone traded it before.
I want to see us breach the 0.382 @ $187.82 at the least before dropping again. Once we finish this b wave, I will draw more refined targets for the next wave. Good luck y'all.
I will be out of town for the next two days on a mini vaca for my sons b-day. I'll still have access to the charts via my phone, but it isn't the same as a computer. Due to this I won't be making new posts tomorrow night but will post again Thursday night.
Also, I want to remind everyone, starting March 1st, my posting schedule will be dramatically altered.
AAPLAAPL was still bullish hold it in till tomorrow. looks like a bull flag on 30 30-minute Macde just close to positive side

AAPL: Support at 160-180, Target 220-240AAPL stock may find support between 160 and 180 and could potentially reach the 220 to 240 range by the second half of 2024.
