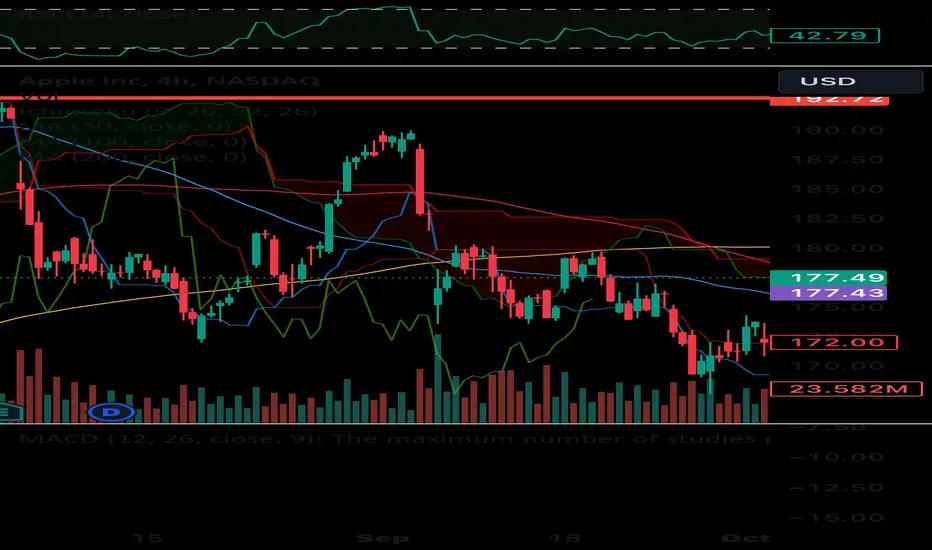
1AAPL trade ideas

AAPL potentially triggers the outside week down.... 2u-2d on the daily
exited a small OTM call play, as it didn't close above Thursday's high
still 2u on the weekly, but <177.99 it's back into the weekly range...
IF THIS THEN THAT
if it takes out 177.99 and keeps going, next weekly pivot is 170.82
below that 167.62 (previous monthly low)
#TheStrat

APPLE My Opinion! SELL!
My dear friends,
APPLE looks like it will make a good move, and here are the details:
The market is trading on 178.89 pivot level.
Bias - Bearish
Technical Indicators: Supper Trend generates a clear short signal while Pivot Point HL is currently determining the overall Bearish trend of the market.
Goal - 174.99
Recommended Stop Loss - 181.47
About Used Indicators:
Pivot points are a great way to identify areas of support and resistance, but they work best when combined with other kinds of technical analysis
———————————
WISH YOU ALL LUCK

AAPLThe beginning of the downward trend and the formation of a new path, I expect the price to fall to a certain range

APPLE: Pullback and breakout buy levels.AAPL reached the top of the 1st Channel Down pattern, staying over the 1D MA50 on a green 1D technical outlook (RSI = 58.956, MACD = 0.610, ADX = 38.858). This rise originated after nearly hitting the 1D MA200, its continuation may very well do so on the 1D MA50.
Our trading strategy is to buy if it closes a 1D candle over the dotted line and target the 2nd Channel Down and the dashed line (TP1 = 185.00). A new crossing there would target the R1 level (TP2 = 190.00). If it fails to close a candle over it and gets rejected, we will buy just inside the Demand Zone and pursue the same target set. A Bullish Cross on the 1D MACD gives an edge to the upside.
## If you like our free content follow our profile to get more daily ideas. ##
## Comments and likes are greatly appreciated. ##

AaplStopped at resistance...
Headed back to 175 minimum here ..
If this drops below 175, then 165 gap close most likely incoming.

Road to the moon: The Flattening of AppleRoad to moon is never easy, if it was easy it wouldn't be valuable.
Down before up is like a slingshot, the harder you pull one way, the stronger and faster it goes the other way.

$AAPL: 180 Not Bad?Apple is showing reslience in this market along with broader marquee names while growth continues to struggle

How to Trade the Gap & GoWelcome to the final instalment of our 7-part Power Patterns series where we aim to give you the skills to trade powerful price patterns which occur on any timeframe in every market.
Last but by no means least is the Gap & Go pattern. Price gaps epitomise power and the Gap & Go is must for any active trading looking to take advantage in a spike in volatility.
We’ll teach you:
How to identify the best Gap & Go patterns
Why the catalyst behind the pattern is crucial
A simple technique for managing a Gap & Go trade
I. Understanding the Gap & Go:
The Gap and Go pattern revolves around a simple concept: market shocks take time to fully price in.
A price gap occurs when a stock "gaps" higher or lower from its previous closing price when the market opens. The price gap represents a shock and in certain circumstances traders can anticipate a continuation of price movement in the direction of the price gap.
Here are the key components of the Gap & Go trade setup:
Identify the gap: The first step is to identify stocks that exhibit a noticeable price gap between the previous day's closing price and the current day's opening price. This gap can be either bullish (a gap up) or bearish (a gap down).
Breaking structure: The price gap should break above or below a level of resistance (or support). Gaps that break key structural levels are likely to draw in a higher level of participation.
High volume: The price gap should occur on higher-than-average volume. Higher volume indicates increased participation and suggests that a significant number of market participants are actively reacting to the news or event that caused the gap.
Bullish Gap & Go:
Bearish Gap & Go:
II. Know the catalyst behind the gap:
Stock prices can gap higher or lower for a multitude of reasons and some of the reasons make better trading catalysts than others.
As a general rule, you want the gap to form on a piece of stock-specific newsflow that has recalibrated market expectations.
Remember, central to the pattern working is that the shock which caused the gap must take time to price in – hence mechanical events such as dividends and corporate actions are of no use, so too are confirmed bids.
The best catalysts for Gap & Go trades will be earnings surprises (good or bad), and a change in outlook (good or bad). In general, trading updates tend to lead to more surprises that Interim and Annual Reports, as they occur within reporting periods.
Good catalysts:
Trading update
Interim results (change of outlook)
Annual results (change of outlook)
Bid rumour
Broker upgrade / downgrade
Bad catalysts:
Ex dividend
Corporate actions
Global news event
Confirmed bid
Top Tip: For the stocks you like to trade, make sure you add a calendar alert for when the company releases Trading Updates and Interim/Annual Reports. This may help you to anticipate price gaps.
III. How to Trade the Gap & Go:
Whilst the Gap & Go pattern can be traded in many different ways and on many different timeframes. We favour getting to grips with this pattern on the hourly candle chart first. On this timeframe gaps will be clear, levels of risk can be kept relatively small, and trades can play out across one or two trading days.
Here’s how to start trading the Gap & Go on the hourly candle chart:
Entry : Wait for prices to stabilise following the opening rotations. The gap should be maintained after the first hour of trading and there should be no signs of exhaustion. Enter during the second hour of trading.
Stop-loss placement : Traders can either place a stop above (or below) the 9 period exponential moving average (EMA) or use a multiple of the Average True Range (ATR) above (or below) the entry price.
Price targets : The expectation for the Gap & Go trade setup is to catch a clean swing of price movement in the direction of the gap. For this reason, the 9EMA is a useful tool as a dynamic profit target – traders should close their position on a close back above (or below) the 9EMA. This method does not cap upside in fast moving markets but ensure discipline and allows traders to attempt to capture the ‘meat of the move’.
Bullish Gap & Go Trade Setup:
Bearish Gap & Go Trade Setup:
IV. Managing risks and pitfalls:
Be wary of opening reversals: It is important that prices stabilise and maintain the gap before entering a Gap & Go trade. On occasions, prices will gap lower only to reverse sharply during the first hour of trading. The stronger your understanding of the subtle nuances of trading around the open, the better you will be at trading the Gap & Go pattern.
Risk management: The Gap & Go pattern by definition is trading during an expansion in volatility. Therefore, it is essential that traders implement proper risk management techniques, such as position sizing and diversifying your trading portfolio.
Disclaimer: This is for information and learning purposes only. The information provided does not constitute investment advice nor take into account the individual financial circumstances or objectives of any investor. Any information that may be provided relating to past performance is not a reliable indicator of future results or performance.

#AAPL Pivotal Trendline Test In this update we review the recent price action in Apple and identify the next high probability trading opportunities and price objectives to target
PAST PERFORMANCE NOT INDICATIVE OF FUTURE RESULTS

Short for APPLTriangle broken. Waiting for the price bound to conclude in order to open a short trade using the Fibo. Extension tool.

Apple Apple (AAPL) stock declined during its recent trading at intraday levels, with the stock preparing to break the support level of 171.95, amid the dominance of a bearish corrective wave in the short term along a slope line, with negative pressure continuing due to its trading below its simple moving average for the previous 50-day period. We also notice the reappearance of a negative crossover in the relative strength indicators.
Therefore, we expect further decline for the stock during its upcoming trading, especially if it breaks the support at 171.95, then targeting the support level at 157.50.
The expected direction for the stock's upcoming trading: bearish
(The stock belongs to the information technology sector, as the company is involved in the design, manufacture and sale of smartphones, personal computers, tablets, wearable devices, accessories and other types of related services. The company was founded by Stephen Paul Jobs, Ronald Gerald Wayne and Stephen J. Wozniak in April / Nissan was founded in 1976 and is headquartered in Cupertino, California).

SVGO has a plugin-based architectureSVGO has a plugin-based architecture, separate plugins allows various xml svg optimizations. See built-in plugins. SVGO automatically loads configuration from svgo.config.js or from --config ./path/myconfig.js. Some general options can be configured via CLI.

$APPL- Apple to New All Time Highs- $240Another stock has shown significant strength after a decline; Apple is resuming heavy bullish movement after a slight pause. Although I do see the potential for a rejection slightly higher, a continuation of bullish price action has me watching the $240 area for an initial target. IF we break to new highs past $195, I will assume that this thesis is in play.
IF $195 highs break, expecting my target of $240 by April 2024.
Possibility of a rejection in the $180's, looking to accumulate around $155 if this happens.

Long short AAPL viewApple is currently at a very good point where we can see that if we zoom out, Apple is at the monthly and weekly major pivot point. AAPL has already tested the support twice and future tests would only increase the probability of going short more. I advise going short only below the double-bottom low and initiating longs above the resistance trend line.

$AAPL - 15 min 2 steps for Bullish Scenario with T1S Indicator:
1. Candles Above the Green Line:
• Check that the candles on the chart are positioned above the green line of the T1S indicator. This could be an indication of bullish momentum.
2. Bars Above Zero:
• Ensure that the bars on the T1S indicator are above zero. This condition might suggest positive market sentiment or upward price movement.
2 steps for Bearish Scenario with T1S Indicator:
1. Candles Below the Green Line:
• Verify that the candles on the chart are positioned below the green line of the T1S indicator. This condition may indicate bearish momentum or a potential downward trend.
2. Bars Negative Below Zero:
• Confirm that the bars on the T1S indicator are in the negative territory and located below zero. This setup suggests a negative market sentiment or downward price movement.

AAPL is coming backDespite of some bad news about the iphone 15, aapl getting back to its level
from the trend and indicator, there is a Positive divergence, price is climbing back to the resistance level =D
Recommendation:
Buy: 175.8-176.5
Sell: 179.05
Stop loss: if fall below 173.15
Disclaimer:
The information and recommendations provided are for informational purposes only and should not be considered as financial or investment advice.


AAPL best level to buy/hold 65% gains swing trade🔸Hello traders, today let's review daily price chart for AAPL/Apple.
Overall, chart looks good, currently pullback/correction in progress.
🔸Strong sequence of higher lows and higher highs and new higher lows
new higher low expected near 150 usd. currently pullback in progress so it's recommended
to wait until pullback is over before reloading. higher highs at 178, 195, new higher high
expected at 240 usd later in 2024.
🔸Recommended strategy bulls: bulls should wait for pullback/correction to complete
near 150 usd later in Q4 2023, and be ready to buy low. BUY/HOLD setup for patient
traders only. final TP bulls is 240 usd, which is 65% gains from entry price. good luck!
🎁Please hit the like button and
🎁Leave a comment to support our team!
RISK DISCLAIMER:
Trading Futures , Forex, CFDs and Stocks involves a risk of loss.
Please consider carefully if such trading is appropriate for you.
Past performance is not indicative of future results.
Always limit your leverage and use tight stop loss.

Apple is looking to push higher - SMC/ICT structural analysisApple has confirmed a structural break to the upside.
We are looking to get into a bullish position by identifying two things:
-Premium/Discount zone: Easily done with a 50% fib.
-The order block responsible for breaking above the previous structural high.
To verify this point of interest, it is important for us to zoom into at least a 1hr or 4hr timeframe to verify a structural change and break to the upside.
Our target would be the ATH.
Keep your eyes on Apple for a good long trade opportunity.

AAPL, 9d/8.18%rising cycle 8.18% in 9 days
==================================================================================
This data is analyzed by robots. Analyze historical trends based on The Adam Theory of Markets (20 moving averages/60 moving averages/120 moving averages/240 moving averages) and estimate the trend in the next 10 days. The white line is the robot's expected price, and the upper and lower horizontal line stop loss and stop profit prices have no financial basis. The results are for reference only.

"Apple's Innovation Odyssey: Exploring the Next Big Catalystanalysts offering a 4 hour price forecasts for Apple Inc have a median target of 200.00, with a high estimate of 240.00 and a low estimate of 125.00. The median estimate represents a +12.68% increase from the last price of 177.49.
AAPL Weekly Harmonic Elliott Wave and Hurst's Cyclic AnalysisOverview:
let's review the key points of the previous update (September 30th):
Wave x of 2 as a double zigzag.
180.29 as the peak for wave x of 2.
We are in the second 40D cycle of the first 80D cycle of the 40W cycle.
Cross of the 40W FLD generated a target of 152 for wave 2 bottom.
Update:
Analysis of the Structure:
I see wave x of 2 as a triple zigzag. We have completed wave a of (z) of x. On Monday, we will have the pullback as wave b of (z), then we will move higher to complete wave x of 2.
179.31 or 180.29 are my potential targets for wave x peak.
Analysis of the Cycles:
On Monday October 9th we will complete the first 10D cycle of the current 40D cycle. Looking into FLDs, the 20D FLD has generated a target of 178.4 (the underlying trend is flat), which was almost met today.
Also on Monday, we will have a cross of the 40D FLD to the upside which generates a target of 184. I think we will not meet this target, but its certainly something to keep in mind that we might exceed the above mentioned targets (179.31 or 180.29).
As mentioned before, I am expecting the 20D cycle trough in the range of 15th to 18th of October and the 80D trough in the range of 25th October to November 7th.
