AMD WEEKLY ANALYSIS after the rejection of the price at the resistance level we will see a reversal to fill fvg
AMD trade ideas

AMD AnalysisPrice played out nicely as analyzed. Price failed to mitigate the bearish POI at 156.73, but reacted strongly to the downside, potentially heading towards the sell-side liquidity at 116.60 next. Once target has been taken, price could potentially go lower to fill the fair value gap, as well as mitigate the bullish POI at 108.79 before deciding to go higher.

AMD Weekly Harmonic Elliott Wave AnalysisOverview: in my previous update published on Jun 10th, I had AMD in wave III of (c) of V of A of (5).
Update: I am doing a bit of relabeling to AMD and I see this name in wave (IV) developing as a double zigzag. When we break out of the hourly descending trendline, it is an indication that wave (V) has started.

Option Trading and How to Master it?Option trading is a type of investment strategy that involves buying and selling options contracts. Options provide the holder with the right, but not the obligation, to buy or sell an underlying asset (such as stocks, indexes, or commodities) at a specified price within a predetermined period.
To master option trading, consider the following steps:
-Educate Yourself: Start by learning the basics of options, including the terminology, types of options, and how they work. Familiarize yourself with concepts like calls, puts, strike prices, expiration dates, and option pricing.
- Understand Risk and Reward: Gain a clear understanding of the risks and rewards associated with options trading. Options can offer leverage but also carry potential losses. Develop a comprehensive risk management plan.
- Paper Trading: Practice trading options using a virtual or paper trading account. This allows you to simulate trades and gain experience without risking real money. Monitor and analyze the performance of your paper trades.
- Develop a Trading Plan: Create a well-defined trading plan that outlines your goals, risk tolerance, preferred strategies, and criteria for entering and exiting trades. Stick to your plan and avoid impulsive decisions.
- Learn Strategies: Explore various options trading strategies such as buying calls or puts, covered calls, spreads (e.g., credit spreads, debit spreads), and more. Understand how and when to use these strategies based on market
conditions and your objectives.
- Technical and Fundamental Analysis: Utilize both technical analysis (e.g., chart patterns, indicators) and fundamental analysis (e.g., company financials, market news) to make informed trading decisions. Learn how these factors
can impact option prices.
- Risk Management: Implement effective risk management techniques such as position sizing, setting stop-loss orders, and diversifying your options trades. Manage your risk exposure by avoiding excessive leverage and staying
within your risk tolerance.
- Continuous Learning: Stay updated with market trends, option trading strategies, and evolving market conditions. Read books, take courses, attend seminars, and follow reputable sources to expand your knowledge and refine your
skills.
- Experience and Patience: Gain experience through actual trading and learn from both successful trades and losses. Patience is crucial in options trading as it takes time to master the intricacies of the market.
- Seek Mentorship or Guidance: Consider seeking guidance from experienced option traders or engaging in a mentorship program. Learning from seasoned professionals can accelerate your learning curve and provide valuable
insights.
Remember that mastering option trading takes time and dedication. It's essential to continuously refine your skills, adapt to changing market conditions, and remain disciplined in executing your trading plan.
How to do Risk Management in trading stock?To practice effective risk management in trading stocks, consider the following key principles:
Set Risk Tolerance: Determine your risk tolerance level based on your financial situation, investment goals, and personal comfort level with potential losses.
Position Sizing: Limit the amount of capital you allocate to each trade based on your risk tolerance. Avoid risking a significant portion of your portfolio on a single trade.
Stop Loss Orders: Implement stop loss orders to automatically sell a stock if it reaches a predetermined price level, limiting potential losses.
Diversify Your Portfolio: Spread your investments across different stocks and sectors to reduce the impact of any single stock's performance on your overall portfolio.
Risk-Reward Ratio: Evaluate the potential risk and reward of each trade. Aim for a favorable risk-reward ratio by seeking trades where potential gains outweigh potential losses.
Research and Analysis: Conduct thorough research and analysis before making any trading decisions. Consider fundamental and technical factors to assess the risk associated with a particular stock.
Stay Informed: Stay updated on market trends, news, and events that could impact stock prices. Being aware of potential risks and market conditions helps you make informed decisions.
Emotional Discipline: Control your emotions and avoid making impulsive decisions based on fear or greed. Stick to your trading plan and avoid chasing losses or making irrational trades.
Regular Evaluation: Continuously assess and review your trading performance, identifying any patterns or areas where risk management can be improved.
Education and Experience: Continuously educate yourself about trading strategies, risk management techniques, and market dynamics. Gaining experience and learning from both successes and failures is crucial for effective risk management in trading stocks.

What is Support and Resistance Line?Support and resistance levels are commonly used in trading to identify potential price reversal points and determine entry and exit levels. Here's a step-by-step guide on how to use support and resistance lines in trading:
1. Define Support and Resistance: Support is a price level where buying pressure is expected to be strong enough to prevent the price from falling further. Resistance, on the other hand, is a price level where selling pressure is expected to be strong enough to prevent the price from rising further.
2. Identify Significant Highs and Lows: Look at historical price charts and identify significant highs and lows where the price has reversed direction. These points represent potential resistance and support levels, respectively.
3. Draw Horizontal Lines: Once you've identified the significant highs and lows, draw horizontal lines across those levels. These lines will act as your support and resistance lines.
4. Validate the Levels: The more times a price level has acted as support or resistance, the more significant it becomes. Look for multiple touches and bounces off these levels to increase their validity.
5. Adjust for Precision: Sometimes, price levels are not exact. You may need to adjust the support and resistance lines slightly to encompass the price action more accurately. Use the candlestick wicks and bodies to fine-tune the placement of your lines.
6. Monitor Price Reactions: Watch how the price reacts when it approaches these support and resistance levels. If the price bounces off a support level and starts to rise, it reinforces the validity of that level. Conversely, if the price approaches a resistance level and starts to decline, it strengthens the significance of that resistance.
7. Consider Confirmation Signals: While support and resistance levels alone can provide valuable information, it's helpful to use other technical indicators or chart patterns as confirmation signals. For example, you may look for candlestick patterns, trendlines, or oscillators that align with the support or resistance levels to increase the probability of a successful trade.
8. Plan Your Trades: Once you've identified support and resistance levels and confirmed them with additional indicators or patterns, you can plan your trades accordingly. For example, you may consider buying near a strong support level with a stop-loss order below that level. Conversely, you might sell or short-sell near a significant resistance level, placing a stop-loss order above it.
Remember that support and resistance levels are not foolproof indicators and should be used in conjunction with other analysis techniques. It's also important to adapt your approach to the specific market conditions and the timeframe you're trading in.
Bullish AMD - 105 Cash Secured Put out to JulyLast week I sold a 105 put in AMD for around 200$. I've collected 1/2 of the credit as it's moved up and as theta has decayed. However today, it's starting to come back down and showing some bearish divergence on the daily. MACD and RSI are not looking great. So will probably hold this put through the weekend and reassess next week.


Loosing steamApparently AMD is forming a double top. Still has to break down the neck line to confirm but those two big red candles show weakness in the buyers. Don't get caught up in this AI fever. It will end and very soon.

AMD 15MIN - GAPS AND FIBS AMD not looking as strong as NVDA but its stuck between and rock and a hard place with higher time frame fib extension, the price structure tells the story of it filled the most resent gaps but still has one below that is part filled. By this the .618 fib level is calling for short term up move for a bigger down move longer term...

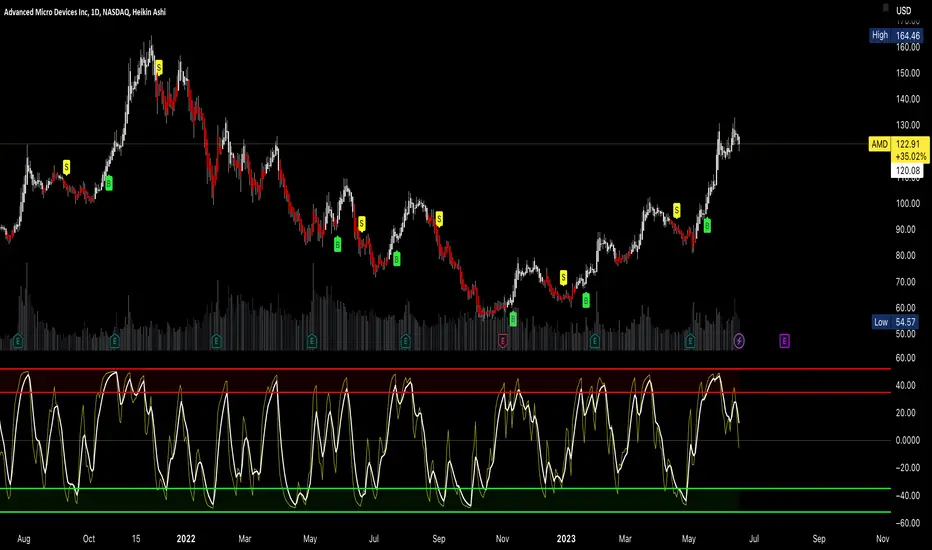
$AMD Divergence on the Hourly ChartNot much left to be said, a break below the 125MA would suggest that fear of losing gains has taken over for AMD and there could be more downside to come.

Current Situation for AMDNASDAQ:AMD investors having a tough time making sense of higher prices right now. They are definitely trading at prices consistent with speculation. How much growth can you get out of AMD at this current moment? In a lower interest rate environment they were averaging 21.90% per year. Over the next 5 years they are projected to average 8.94%.
The age of high growth may be behind us for now. Investors will have to get used to the new reality that exists. This clout grab from AI implementation is going to fade over time.

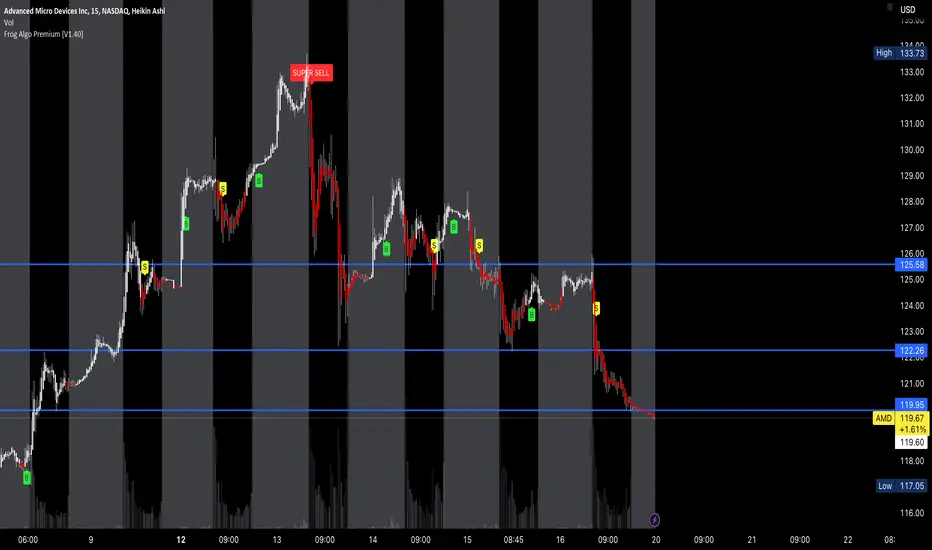
AMD: Sell ideaSell idea on AMD as you see on the chart because we have:
- a squeeze;
- breakout of support line;
-breakout of vwap indicator.
So it's mean that we will have a big probability to have a downtrend. Thanks!

Bullish IdeaAMD is trading strong above key moving averages. It came down a bit for a breather and I feel its ready for another move up. This is not an entry for me quite yet. Simply sharing this to be prepared. Price is approaching the vwap. If it gets above and holds there is buyer support and I would consider a long position.

AMD make or break time ⏰parabolic break past trend resistance, now revisiting that trend line 🙈
scenario 1: resistance turns support, we bounce to 125-138 from here
scenario 2: break back below trend resistance, dip to 100 level before more upside
either way the trend is in favor of the bulls (by a longshot), so bears should trade with caution here :)
Boost and follow if this helped, thanks ❤

AMD: Buy ideaOn AMD as you see on the chart we have a buy idea because we have the breakout with force the vwap indicator.Thanks!

AMD AnalysisPrice consolidated since my last analysis. No changes to my expectations, I'm expecting price to continue lower, taking out the sell side liquidity at 116.6, and potentially the bullish POI at 108.79 next.

AMD Weekly Harmonic Elliott Wave AnalysisOverview: in my last update of AMD published on May 19th, I had AMD very close to the completion of wave A of (5) and had 109.05 and 110.58 as my potential targets.
Update: AMD surpassed the bullishness that I assumed. Right now, I see AMD in wave III of (c) of V of A of (5).

Is AMD topping out AMD's Sideways Consolidation and Bearish Harami Signal
In the market analysis, it has been observed that Advanced Micro Devices (AMD) exhibited a bearish harami candlestick pattern on the 4-hour chart, indicating a potential reversal in the stock's price direction. This pattern occurred after a period of sideways movement within a 14-point range, spanning over the past 15 days.
The bearish harami pattern suggests a possible shift in market sentiment, with the potential for a downward movement in AMD's price. The pattern consists of a small candlestick, usually representing a trading day with a narrow price range, that is completely encompassed within the previous day's larger candlestick. This formation indicates a potential weakening of the bullish momentum and a potential reversal towards a bearish trend.
Furthermore, the preceding period of sideways consolidation, marked by a range of 14 points, indicates a lack of significant price movement or direction. This consolidation phase often signifies a period of market indecision or equilibrium between buyers and sellers. Traders and investors closely monitor such consolidations as they may anticipate a breakout or breakdown from this range, potentially leading to a new trend.
Considering the combination of the bearish harami pattern and the recent sideways consolidation, market participants should exercise caution when trading or investing in AMD. Traders may consider waiting for further confirmation of a potential downward move, such as a break below a key support level or the development of additional bearish candlestick patterns. Similarly, investors might reassess their positions and monitor the market closely for any significant developments that could influence AMD's future price trajectory.
As with any market analysis, it is important to keep in mind that price movements in financial markets are influenced by a variety of factors, including market sentiment, economic indicators, company-specific news, and broader market trends. Therefore, it is advisable to conduct comprehensive research and utilize additional technical and fundamental analysis tools to make well-informed investment decisions.

AMD UptrendTargeting $160 according to Fibonacci.
This was a tricky one when listening to all the bad news,
however Semiconductors is what we all need going forward.
AMD will be a winner along with the Semi-Team if not the greatest for now?

AMD -> Wait For This SupportHello Traders,
welcome to this free and educational multi-timeframe technical analysis.
On the weekly timeframe you can see that AMD stock is currently retesting and already starting to reject a quite nice previous weekly resistance area at the $130 level.
You can also see that the overall uptrend is still valid, after the recent 50% pump AMD is definitely ready for a correction though so I am now just waiting for a correction back to the next support zone at the $105 level before I then do expect more continuation towards the upside.
On the daily timeframe you can see that market structure is still bullish, I am also not really interested in actually shorting AMD, instead I am waiting for a retest of the $105 area and some bullish confirmation and then I do expect another rally towards the upside from there.
Thank you for watching and I will see you tomorrow!
You can also check out my previous analysis of this asset:

Is AMD a good buy?AMD (Advanced Micro Devices) is a multinational semiconductor company that specializes in designing and manufacturing computer processors, graphics processing units (GPUs), and other related technologies. AMD is known for its Ryzen processors, Radeon graphics cards, and EPYC server processors. The company competes with Intel in the CPU market and NVIDIA in the GPU market, aiming to provide high-performance and energy-efficient solutions for various computing needs, including gaming, data centers, and personal computing.
Starting from a technical perspective, looking at the monthly chart, AMD looks like it may have finished its grand cycle after completing 5 big waves up according to the Elliott Wave theory, especially since the price did not manage to break above the 100% Fibonacci Extension level ($165.00 zone) which may signal the end of a cycle according to Elliott Waves. Thus, we may currently be in the middle of an ABC corrective cycle specifically in wave B which is an upside retest before the downside continuation. Since the price is retesting a critical zone, the $130.00 area (61.8% Fibonacci Retracement and yellow trendline retest), not breaking above it will be a great opportunity to short this stock towards $75.00 as our first target (previous wave iv). Breaking $75.00 will cause further downside toward retesting previous lows.
From a fundamental perspective, one concern about investing in AMD stock may be its seemingly stretched valuation. AMD currently trades at a price-to-earnings (P/E) ratio of 31.5 times, which is almost 70% above the industry average. It is also well above some of its main peers, such as Intel, which trades at a modest 8 times.
Because it's considered a growth technology stock, the market has priced AMD according to its future potential, rather than its financial results. However, AMD's valuation has been higher than its peers due to its sharp growth — over 760% in the last five years — and its opportunity to keep growing at a considerable pace.
This puts AMD under pressure to keep reporting high revenue growth, and not meeting investors' expectations may be catastrophic for the company's stock price in case of a bad earnings report. Investors who delve deeper into the semiconductor sector may find cheaper opportunities at the moment.
Not to mention the combination of tight monetary policy and declining credit availability which could take its toll on the economy over the course of the year. A weak economy will pressure earnings growth and likely lead to negative sentiment in the markets.
Note that evaluating a company's growth potential is crucial. If a stock's valuation is based on overly optimistic growth expectations that may not materialize, such as today's AMD case during an AI bubble boom, it could be considered overvalued.
Goodluck everyone.
M.Y.

AMD Risk On SetupAMD 65m: Displaying relative strength; Intraday KLs 115.48, 117.93,120.20, 121.93, 122.78, 123.51, 125.77, 127.00 // ATR: 4.94, Beta: 1.9, IV: 50.39%, RVOL .69 (on 65m time frame) //Bias: Neutral-Risk On// Price at time of publish 121.97
