TradeUSAsignals RecommendationsAVGO - Long (5% of your portfolio) - Order filled @ 342.50
An up trend controlled by Bias traders with both Time and Price traders against the trend.
Key facts today
Next report date
—
Report period
—
EPS estimate
—
Revenue estimate
—
4.03 USD
5.89 B USD
51.57 B USD
4.63 B
About Broadcom Inc.
Sector
Industry
CEO
Hock E. Tan
Website
Headquarters
Palo Alto
Founded
1961
ISIN
US11135F1012
FIGI
BBG00KHY5S69
Broadcom Inc. is a global technology company, which designs, develops, and supplies semiconductors and infrastructure software solutions. It operates through the Semiconductor Solutions and Infrastructure Software segments. The Semiconductor Solutions segment refers to product lines and intellectual property licensing. The Infrastructure Software segment relates to mainframe, distributed and cyber security solutions, and the FC SAN business. The company was founded in 1961 and is headquartered in Palo Alto, CA.
Related stocks

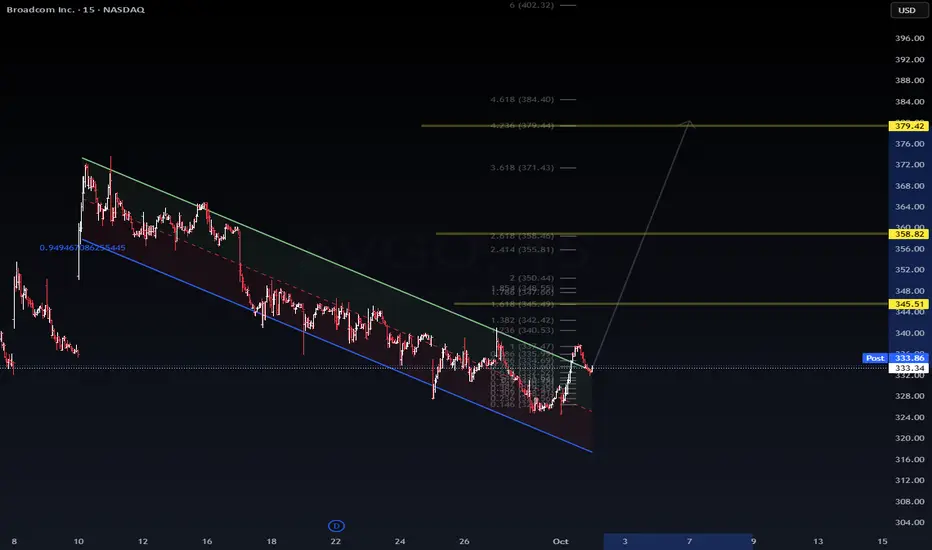
$AVGO | Broadcom – Institutional DSS ProjectionNASDAQ:AVGO | Broadcom – Institutional DSS Projection
Price has broken out of the descending channel and is testing early reversal confirmation.
Immediate resistance: $340.50 – $345.51
Mid-term target: $358.82 (Fib 2.618)
Extended projection: $379.42 (Fib 4.236)
Institutional model suggests ac
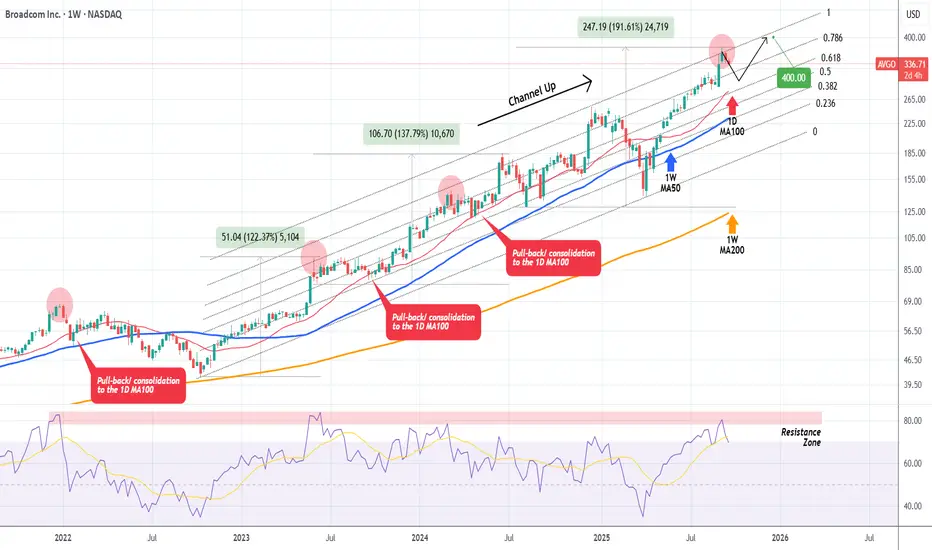
BROADCOM Rejection at the top of 3-year Channel Up possible. Last time we looked at Broadcom Inc. (AVGO) was more than 3 months ago (June 10, see chart below), where we gave a buy signal, targeting $320:
The price is now on the 2nd straight red week after it marginally breached above its 3-year Channel Up, and if it closes in red eventually, we will have
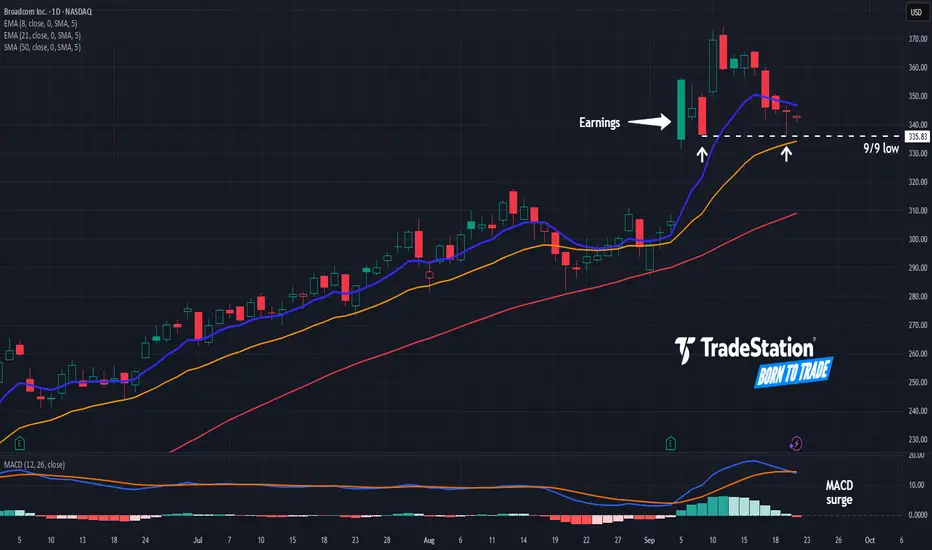
Broadcom Rallied. Now it’s Pulled Back.Broadcom surged to new record highs two weeks ago and now it’s pulled back.
The first pattern on today’s chart is the gap on September 5 after results beat estimates and management revealed a new large customer. That surge may reflect bullish sentiment in the chip stock.
Second, AVGO went on to ma
AVGO OCT 2025AVGO (4H): Rejected at 350–345 and still trading under the descending trendline. Distribution overhead persists into 370 where heavy sell programs hit. If buyers can absorb above 345, momentum can shift; otherwise, watch the 316 gap and the 300–290 base for further absorption.
• Upside targets: 370

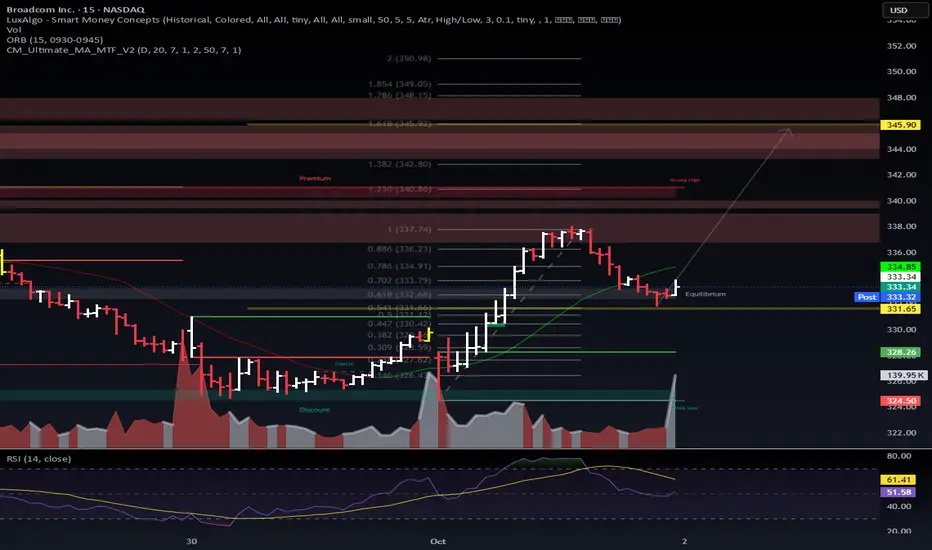
$AVGO – Flow + TA Alignment📈 NASDAQ:AVGO – Flow + TA Alignment
AVGO sitting at equilibrium (~332–333) after tagging resistance. Options flow + fib extensions are pointing toward the next magnet zone.
🔑 Key Levels
Support: 330 → invalidation level.
Short-term target: 346–348 (1.618 fib + heavy call flow strikes).
Mid-te
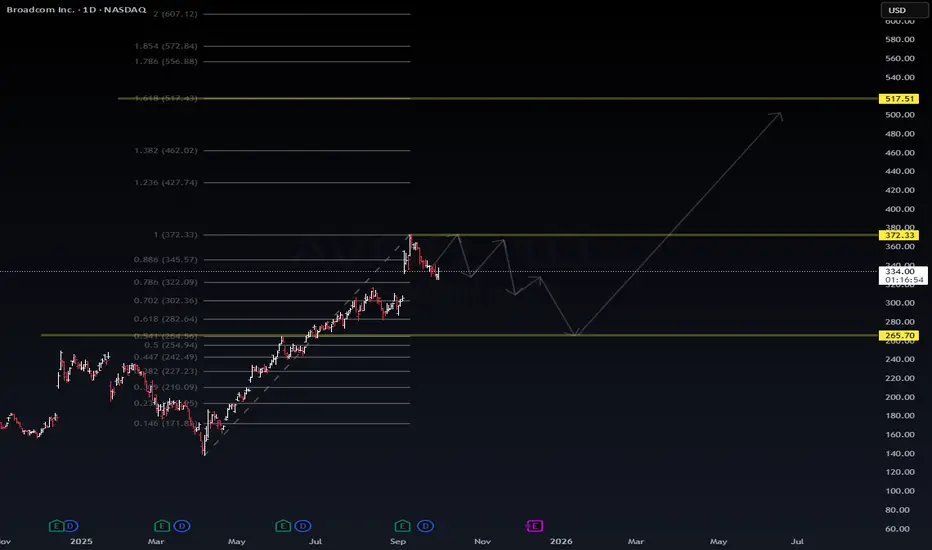
$AVGO | Decision Zone – Bounce or Deeper Pullback?NASDAQ:AVGO | Decision Zone – Bounce or Deeper Pullback?
🔹 Technicals
Current: 333.9 (+1.2%)
Fib retracement showing key levels:
372.3 = resistance / upside pivot
322.0 → 302.0 = short-term support band
265.7 = deeper liquidity target if breakdown extends
Larger fib extensions point toward 51
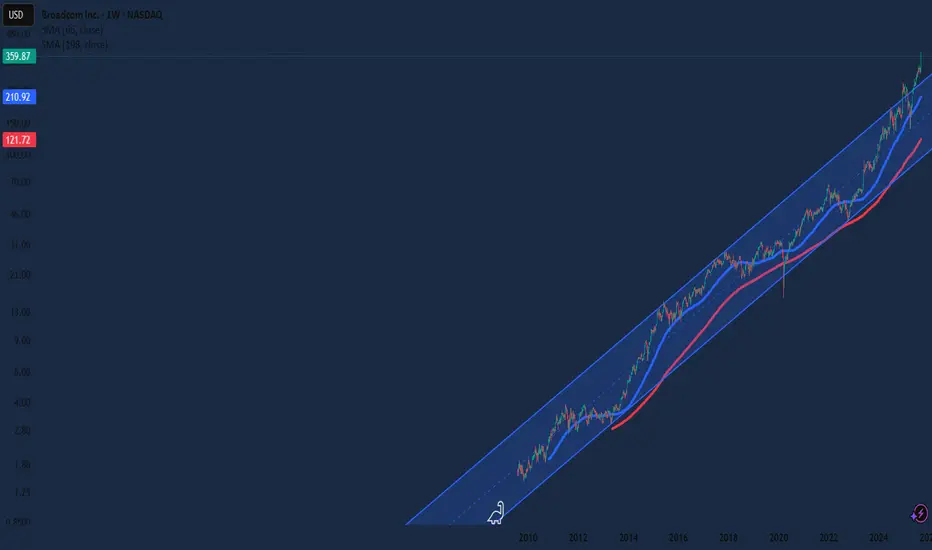
$AVGO – Strong Uptrend Intact, Backed by Robust Fundamental GrowSTRONG BULLISH | Ticker: AVGO (Broadcom Inc.) | Timeframe: Daily/Weekly
NASDAQ:AVGO is demonstrating a powerful and sustained uptrend, and the recent Q3 FY25 earnings report provides fundamental confirmation that this momentum is well-supported.
📈 Technical Perspective:
The stock is in a cl
$AVGO with a bullish outlook following its earnings #StocksThe PEAD projected a bullish outlook for NASDAQ:AVGO after a positive over reaction following its earnings release, with an expected accuracy of 84%.

Climax top on earningsNASDAQ:AVGO could have made a climax top in its final run on its earnings call.
Reasons:
1. Huge RSI divergence on daily
2. Huge reversal on highest volume
3. Its NASDAQ:SMH peers like NASDAQ:NVDA , NASDAQ:AMD continue to fall with more downside.
4. 1 Hour count on what I believe the final

See all ideas
Summarizing what the indicators are suggesting.
Neutral
SellBuy
Strong sellStrong buy
Strong sellSellNeutralBuyStrong buy
Neutral
SellBuy
Strong sellStrong buy
Strong sellSellNeutralBuyStrong buy
Neutral
SellBuy
Strong sellStrong buy
Strong sellSellNeutralBuyStrong buy
An aggregate view of professional's ratings.
Neutral
SellBuy
Strong sellStrong buy
Strong sellSellNeutralBuyStrong buy
Neutral
SellBuy
Strong sellStrong buy
Strong sellSellNeutralBuyStrong buy
Neutral
SellBuy
Strong sellStrong buy
Strong sellSellNeutralBuyStrong buy
Displays a symbol's price movements over previous years to identify recurring trends.
Curated watchlists where AVGO is featured.


Frequently Asked Questions
The current price of AVGO is 338.37 USD — it has increased by 0.06% in the past 24 hours. Watch Broadcom Inc. stock price performance more closely on the chart.
Depending on the exchange, the stock ticker may vary. For instance, on NASDAQ exchange Broadcom Inc. stocks are traded under the ticker AVGO.
AVGO stock has risen by 0.28% compared to the previous week, the month change is a 11.94% rise, over the last year Broadcom Inc. has showed a 99.49% increase.
We've gathered analysts' opinions on Broadcom Inc. future price: according to them, AVGO price has a max estimate of 425.00 USD and a min estimate of 300.00 USD. Watch AVGO chart and read a more detailed Broadcom Inc. stock forecast: see what analysts think of Broadcom Inc. and suggest that you do with its stocks.
AVGO reached its all-time high on Sep 11, 2025 with the price of 374.23 USD, and its all-time low was 1.43 USD and was reached on Nov 4, 2009. View more price dynamics on AVGO chart.
See other stocks reaching their highest and lowest prices.
See other stocks reaching their highest and lowest prices.
AVGO stock is 2.58% volatile and has beta coefficient of 2.04. Track Broadcom Inc. stock price on the chart and check out the list of the most volatile stocks — is Broadcom Inc. there?
Today Broadcom Inc. has the market capitalization of 1.60 T, it has decreased by −2.77% over the last week.
Yes, you can track Broadcom Inc. financials in yearly and quarterly reports right on TradingView.
Broadcom Inc. is going to release the next earnings report on Dec 11, 2025. Keep track of upcoming events with our Earnings Calendar.
AVGO earnings for the last quarter are 1.69 USD per share, whereas the estimation was 1.66 USD resulting in a 1.69% surprise. The estimated earnings for the next quarter are 1.86 USD per share. See more details about Broadcom Inc. earnings.
Broadcom Inc. revenue for the last quarter amounts to 15.95 B USD, despite the estimated figure of 15.83 B USD. In the next quarter, revenue is expected to reach 17.44 B USD.
AVGO net income for the last quarter is 4.14 B USD, while the quarter before that showed 4.96 B USD of net income which accounts for −16.62% change. Track more Broadcom Inc. financial stats to get the full picture.
Yes, AVGO dividends are paid quarterly. The last dividend per share was 0.59 USD. As of today, Dividend Yield (TTM)% is 0.70%. Tracking Broadcom Inc. dividends might help you take more informed decisions.
Broadcom Inc. dividend yield was 1.25% in 2024, and payout ratio reached 170.61%. The year before the numbers were 2.19% and 55.79% correspondingly. See high-dividend stocks and find more opportunities for your portfolio.
As of Oct 6, 2025, the company has 37 K employees. See our rating of the largest employees — is Broadcom Inc. on this list?
EBITDA measures a company's operating performance, its growth signifies an improvement in the efficiency of a company. Broadcom Inc. EBITDA is 32.72 B USD, and current EBITDA margin is 48.98%. See more stats in Broadcom Inc. financial statements.
Like other stocks, AVGO shares are traded on stock exchanges, e.g. Nasdaq, Nyse, Euronext, and the easiest way to buy them is through an online stock broker. To do this, you need to open an account and follow a broker's procedures, then start trading. You can trade Broadcom Inc. stock right from TradingView charts — choose your broker and connect to your account.
Investing in stocks requires a comprehensive research: you should carefully study all the available data, e.g. company's financials, related news, and its technical analysis. So Broadcom Inc. technincal analysis shows the buy rating today, and its 1 week rating is buy. Since market conditions are prone to changes, it's worth looking a bit further into the future — according to the 1 month rating Broadcom Inc. stock shows the buy signal. See more of Broadcom Inc. technicals for a more comprehensive analysis.
If you're still not sure, try looking for inspiration in our curated watchlists.
If you're still not sure, try looking for inspiration in our curated watchlists.