EditAnother thought is if we are going to create a cup and handle pattern here we could head down and create a handle
EDIT trade ideas

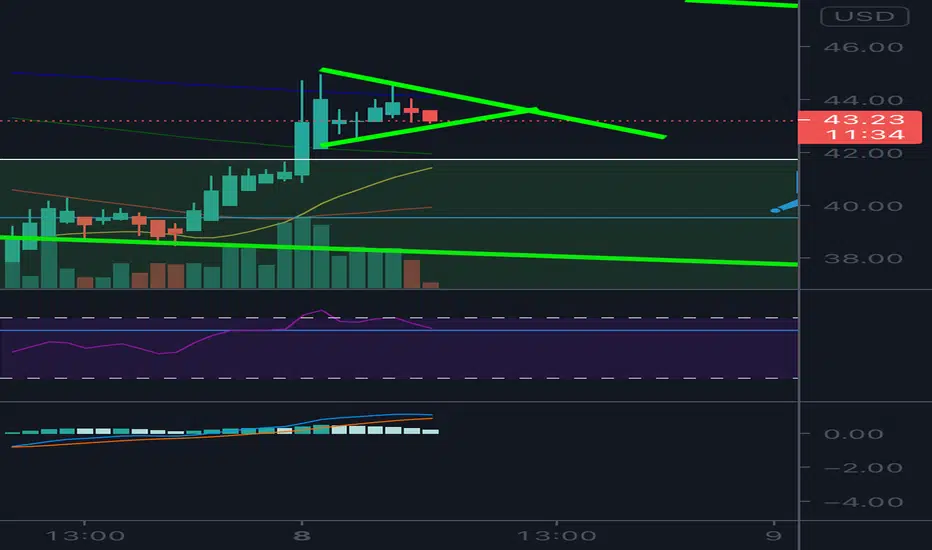
EditAlthough it looks be consildating ver nicely int a bull flag, momentum has slowed down a lot. It doesn’t have to play out like this but it is something I am keeping on my radar depending how this plays out. If we just contiue sideways this will be bullish also. We have run up quite a bit so we will see how everyrhinf plays out. It still looks like a strong uptrend so likely hood if it falling is more slim but keeping this idea on my mind

EditDon’t sleep on edit. It’s been running the
Game!
Looks like it’s trying to test the 49.19 resistance e level. Looking for a close above 48.23 at 1.30 I feel it’s a very important level to close a 4hr candle above. Let’s gooooo
Been long 84 shares since 43$

EditLooks to be in a rising channel or bull flag. Seeing how bullish this has been I am calling I a bull flag. I stayed long although I considered taking profits at 48 area, as I knew we needed a correction, we fell almost perfectly to my support area around 45.78. In very confident this is heading to try to breakout of long term falling channel. This target breakout of 53$ is 81$
For now the bull flag potential if closes and volume supported above 47.56 , is a target of 51.50$ !
Other wise a breakdown we still have stronf support at
45.78
45.15
44.20
And 43.92.

EditWe were making a cup and handle pattern yesterday looks like it’s trying to breakout from it. If we can get some closes above 44.20 today it will be looking bullish AF with a target of 52$. Although it could still be a trap depending on what the market does, the daily candle close will mean a lot today. Could be a bullish reversal setup


EditThis is the bull pennant I am watching. 44.20 is the breakout level we want to get an entry if hourly close above .

EditMan I love
This stock.
Having a great break of a big W pattern. Finding support with great volume above my support box. Watching for the volume at 11:30 next hourly close. Would like to see a close above 43.89 50 EMA on 1 he. I am long this but adding more to position if we can get this next candle close wirh volume. Keep an eye. RSI looking strong, flaggin out on smaller time frames. Breakout above top line marked is a great breakout


big stock, small bounce$EDIT pin action along this disjointed downward channel about to touch a decent support level to rest & bounce at the .618. I suspect it'll fail at .382 back down - barring good news or heavy risk on market participation. Possible cup & handle afterward and/or until more sector news, better earnings, or maybe until ARK dumps pallets of cash on it. If it gets chased back up in the near term, my bull thesis is 70,00 ~mid April. Cheers


Edit Having obvious massive correction. I played this from 27$ -73$. It’s a powerful stock and company with very very good fundamentals. A cure for childhood blindness. You can see the structure it is creating. A breakout of the 40$ level sent it hauling up 150%. It has been in a very massive falling wedge as it comes down to re test old long term resistance of 3 years strong. If in fact it wasn’t to have a resistance flip here, which I expect it will, I’m targeting around 40$ as the final place for a good bounce or consilidation proving that it is for sure now new found support. This is my veiw and I am buying the dips as we reach. Closer to my potential target. 42$ range as of now has been good support. Still expect a few dollar move lower

EDIT/CRSP accumulating Some key indicators are pointing to a possible short term bottom here for both CRSP and EDIT.
Disclaimer, this is only for entertainment and education purposes and doesn't serve by any means as a buy or sell recommendation.
Personally I hold both long term long positions and occasionally short term short position, for disclosure purpose.


Edit47.03 is the breakout of this big falling wedge with target of 63$ But main resistance above is 47.70

Edit 47.70 hourly close above with volume supported stoploss at 46.80. Exit some at 51.98. Long okay would
Be to 63$

I'm watching its daily price action now.Editas Medicine is a clinical-stage biotechnology company which is developing therapies based on CRISPR–Cas9 gene editing technology.

Long | EditNASDAQ:EDIT
Possible Scenario: LONG
Evidence: Price Action
TP1 ~68$,
This is my idea and could be wrong 100%
*Call options 16 April, Strike 70$

Worth the waitThe correction looks over with wave 2 retracing upto 78% of Wave 1 and we should begin the uptrend with the large Wave 3 in a 5 wave pattern. Fun ride.

Edit Breakout resistance is 48.18. Hurly close and volume supported. Resistance at 51.73 and 50.
Target is 63$

ABC BullishPossible stop below C. B is 99.95.
Long impulse wave up and has pulled back to the 0.786.
This one can be very volatile and retests of C are common..and it may go lower than C so maybe set stop accordingly.
Not a recommendation.
There are no rising wedges in the yearly chart. Todays candle is a green engulfing candle. Some use the 5 crosing the 20 as a buy signal and the 5 has not crossed up and through the 20. Long term MAs are sloping up, the 50 is sloping down. NV and OBV are perking up.
Long entry level is an at or above level.

EditLooking for retest of old pattern breakout. Looking for new found support on old resistance. Might pick some up here and see what happens
Company with cure for blindness. Bomb AF in my book!!!
