US100 SHORTMy US100 analysis is short position currently. This is just my own opinion.
Trade at your own risk!
NDX trade ideas


NAS100 ShortElite Trading
Discretionary Trade
Executed trade in 5 minutes
Targeting Lower Liquidity Pools
Main Target Weekly Market Structural Liquidity

A short term analysisUs 1 year bond is showing a strength which means dollar will or might do the same thing, expenditure of dollar will go to stock etc, on the other hand, the stock VALUE will be allocated to paper money DOLLAR
Not a financial adviice

CHART BREAKDOWN NASDAQ: Key Levels, Targets and Thoughts!Trade Update: NASDAQ
We have some great news on our recent NASDAQ trade! 💲
After analyzing the market conditions and identifying a solid setup, our trade has successfully Hit Take Profit 3 (TP3). This made sure that 100% of our positions have been secured and cashed out, allowing us to lock in ALL profits.
Following this, we closed this trade fully with a Risk to Reward of 10! This strategy not only protects our capital but also gives us the opportunity to capture further potential gains.
Stay tuned for more updates and happy trading! 🚀

US100NASDAQ Poised for Continued Upswing, Eyeing 20,650 Range
In the current market landscape, NASDAQ appears primed for further ascent, targeting the 20,650 price range. Supported by robust momentum, the index is positioned to maintain its upward trajectory. Crucially, it is residing comfortably above both the exponential moving averages (EMAs) of 21 and 90 periods, indicating sustained bullish sentiment.
The NASDAQ's resilience is underpinned by several factors. Firstly, favorable economic indicators coupled with positive corporate earnings continue to bolster investor confidence. Additionally, ongoing fiscal stimulus measures and accommodative monetary policies provide further tailwinds to equity markets.
Furthermore, the index's ability to sustain levels above key EMAs, particularly the 21 and 90-day EMAs, underscores the strength of the prevailing bullish trend. This implies that the market sentiment remains buoyant, with investors exhibiting a propensity to buy on dips, further reinforcing the upward bias.
However, prudent risk management remains imperative, as market dynamics can swiftly evolve. While the current outlook suggests continued upward momentum, potential geopolitical tensions or unforeseen economic headwinds could introduce volatility.
In conclusion, NASDAQ's upward trajectory, targeting the 20,650 range, is supported by robust fundamentals and technical indicators, with the index comfortably positioned above key EMAs. Yet, vigilance and adaptability are essential amidst evolving market conditions.

history repeats itselfnas100 daily chart for educational use only,as we can see previously how price reacted after it broke a major level.creating higher highs and higher lows,it is expected for price to continue in that pattern

US 100 SHORTUS100 already break 30m EMA. Curently 4H on retracement will looking on US Session for entry again

NAS100 I Sentiment remains bullish I watch for these key areasWelcome back! Let me know your thoughts in the comments!
** NAS100 Analysis - Listen to video!
We recommend that you keep this pair on your watchlist and enter when the entry criteria of your strategy is met.
Please support this idea with a LIKE and COMMENT if you find it useful and Click "Follow" on our profile if you'd like these trade ideas delivered straight to your email in the future.
Thanks for your continued support!Welcome back! Let me know your thoughts in the comments!

NAS100Hello guys happy new month
for the new month i am expecting prices to pullback at least to the 18000
Reasons :
1. Bullish Engulfing on the 1M timeframe
2.50% fib retracement at 18000
3.Trend line at 18000 psychological level

Nas100 bears takeover Here's the possible senerios i like to see play out next week.
Bearish continuation: after a long run with the bulls the retrecement has been strong and we might see price drop lower to the 0,5 - 0.618 fib level there we can find order blocks and FVG
But lets see if price will respect the 1 hr order block above at level 18.624,00
If not the bulls might take over and will keep pushing price higher

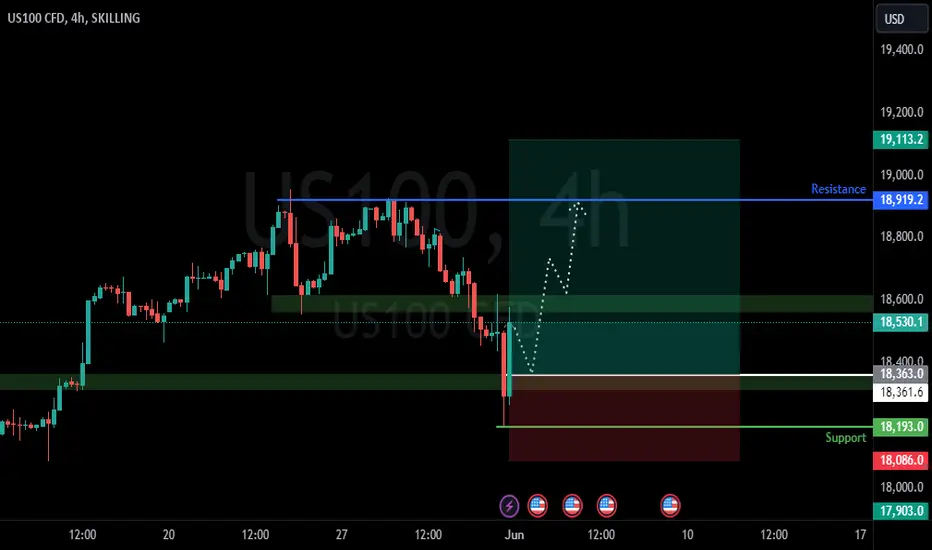
Nasdaq PlayBook SetUp IdeaExpecting price to drop at Sunday open 18,580 and then find support 18,500. From 18,500 on the 1 Hour Time Frame we can expect some buying pressure to 18,800. Cloning the bullish Move that started from 18,200 to 18,600 which was a 400 points move. We can now Project another Bullish move from 18,500 to 18,900 which happens to Hold some supply levels and also some liquidity.


3 Day and 1 Day chart of the NDX PSA
I really don't post much anymore at but I do trade.
This is PSA is showing you that will maybe happening.
The two percent down and up routine leaves you with a daily doji but the Heiken Ashi candle on the left paints a most honest picture. One day chart on left.
Market was strong on open today NYSE TICK was 800 to 1000 and was very positive on open, and this was the dumped on. Market and then returned like it never happened. Not normal price action.
The Nikkei USD contract NKD1 didn't even move as the NDX sold off 2% it usually moves in sympathy with US Indices and usually more volatile.
Since at the end of the day the NDX closed flat. They always know.
Bottom line that one day Heiken Ashi is very negative, not that a spinning top - doji is positive.
The 3 day chart shows clearly there is divergence on my indicator to boot.
If we get to a good sell off we can return to 17688 there is a fair value gap to fill there, and is close to the .618 Fib level on daily.


NASDAQ: Perfect pullback execution. Bullish reversal next week.Nasdaq delivered the expected pullback which was validated when it crossed under the 4H MA50. Today it almost reached the 1D MA50, which is also where the 4H MA200 sits, turned momentarily bearish on the 1D technical outlook (now neutral/ RSI = 47.140, MACD = 151.030, ADX = 59.182) and the 1D RSI achieved symmetry with the December 6th 2023 Low. We still expect the 1.5 Fibonacci extension to get reached before the next pullback (TP = 19,250).
See how our prior idea has worked out:
## If you like our free content follow our profile to get more daily ideas. ##
## Comments and likes are greatly appreciated. ##

Pre- Market analysis for first week of June 2024Either as soon as Sunday reopens
or perhaps London KZ /NY KZ,
I'm expecting for price to come tap
the low from Friday -last day of May.
OFC wait for a 1-5min BOS upward
for confluence on entry technique.
Expecting it to eventually take May's
high but will just target this upper
area. I think 500 pips will do me just
fine.

NASDAQ Analysis - Selling OpportunityNASDAQ Analysis - Selling Opportunity
Open: 18,883
SL: 19,0000
TP: 18,480

US Nas 100 _ Most _ Secure _ Trading _ Strategy _ Under _ TradinUS Nas 100 _ Most _ Secure _ Trading _ Strategy _ Under _ Trading _ Venue _ OANDA
Retest must hold within the key level of : $17,947 , $17,794.4, if support is not confirmed then we will be going as low as $17,354
B = Buy
S = Sell
If you're a professional trader then you'r first level of entry is at $17,824, otherwise, your safe secure level of confirmation is $18,090.2. Then simply follow each retest until market arrive at the advance Stage.
B : $17,824
S: $18,253.7
First trade executed
__________________
B: $17,947
S : $18,396.9
Second Trade Executed
_____________________
B: $18,090.2
S: $18,928.6
Third trade executed
_____________________
B : $18,253.7
S: $19,153.5
Forth Trade Executed
____________________
B: $18,621.8
S: $19,77.2
Fifth Trade Executed
_____________________

Will Bulls Balk at Trendline Resistance?Price of NDQ is nearing a trendline formed by the dotcom bubble and November 2021 high. This zone could repel price, big drops can be expected if we breach the price of 16249.19 on pullback. For now bystanders are needed to enter, unless a clear cycle failure best not to stand in the way of exuberant bulls.

NAS Weekly Idea 5.28.24My Usual Setup that I didn't publish... still has some interesting levels to play out.
