SNDL trade ideas

Sundial Growers Inc (NASDAQ: $SNDL) Ready To Boom Spring 2021 🌼Sundial Growers, Inc. engages in the production and distribution of flower, pre-rolls and vapes. The firm offers licensed producer, ACMPR, cannabis, medical cannabis, health and wellness, and cannabis extracts. The company was founded by Stanley J. Swiatek and is headquartered in Calgary, Canada. The listed name for SNDL is Sundial Growers Inc. Common Shares.


SNDL BUY/LONG OPPORTUNITY NOW READY! Technical Analysis
1. Large Head & Shoulders
2. Fibonacci Retracement at 0.618 (Golden Zone)
3. Pennant/Falling Wedge
4. 1st Take Profit will hit the key Impulse of the massive sell (Some resting sell orders will be there hence pushing the price down which would
create a breakout and retest of Head & Shoulders formation) - Note that the 1st Take Profit Level is also at Fibonacci Expansion Level 1 (Grey Zone)
which is good for safe take profit
1st Take Profit: 3.0000
Re-Entry: 1.9000
2nd Take Profit: 4.1000

SNDL: The most important Key-Point for the short/mid-term!Hello traders and investors! Let’s see how SNDL is doing today! Since our last analysis, it didn’t move much, but on the bright side we still have some good stuff going on here. Let’s talk about it.
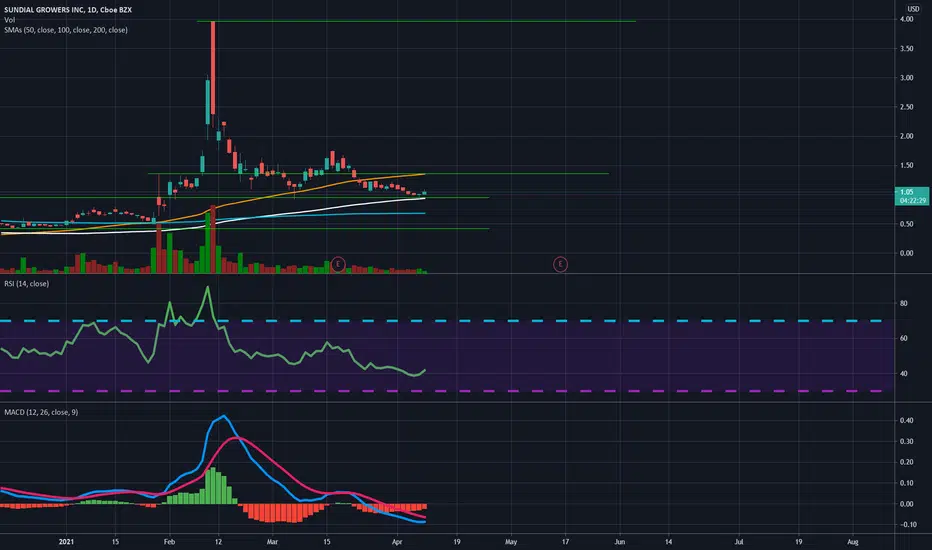
First, it seems the support level around the $ 0.95 is working as a nice support level, indeed, as we already expected weeks ago. It did a good sign on April 8, when it did this nice Harami candlestick pattern, but SNDL is quite weak, and now it is back to the support level.
But again, it is a support level, so, there’s not much to do, but wait for a reaction. In the daily chart the support at $ 0.95 is clearly the most important key point to keep in mind for now:
If we see any reaction around here, SNDL could easily retest the $ 1.64, at least. The $ 1.64 was a previous resistance , and now it is a target for us, but only if SNDL does anything good around.
What would take for it to react? First, the volume – it must increase in order to form a nice bullish structure. Second, we must see a bullish pattern in the daily chart that confirms the possibility of a reversal.
Reversals are risky plays, but since the R/R ratio is quite good, it is worth to trade it. Let’s follow SNDL closely, and if you liked this analysis, remember to follow me to keep in touch with my daily studies, and please, support this idea!
Thank you very much!

SNDLMID-TERM: Daily/4hr classic bullish divergence on MACD, daily hidden bullish divergence on RSI, bullish pinbar candle, at support, potential double bottom. (not financial advice)

Looking like a run is inbound.No news of any marijuana legislation has been a good thing for stocks in the field as they have stagnated in value as of late. I will be increasing my positions here awaiting some executive action possibly for legalization. News will come soon. I like how cheap Sundial is as well. They may not be a power play like some of the other marijuana stocks, but they have way more room to go upwards than most others. They also carry a major chance to be acquired by another company as well.
Keep your eyes peeled.

longit all started with a hammer candele
that was on the support line .
and how can we not pay attention to the high volume.
remember!
this is just my personal opinion,
not a recommendation.
MR. CHERNIAK

Is now the time for SNDL.?Looking at the daily chart SNDL has been beaten down over the past few weeks. We saw this go down below a dollar, but i did not panicked and instead kept holding in the hopes of a move up. A few states are in the process of legalizing cannabis which will be good new for the cannabis sector. Watch for the MACD to turn green, and the RSI is heading up.
SNDL D1Price has reached a key area of support & yesterday has rejected off 0.92 with a bullish pin bar to finish off the day. I am expecting price to rise while trading above this zone, to visit the last area of structure resistance above once again..

Wave 2 Bottom fishing in SNDL for the next bull runThis is my Idea for SNDL based on Elliott Wave Counts and Fibo Extension.
A-B-C Correction and Wave (2) should end between the 61,8 and 88 Fibo, which should result in a new bull run.
Please let me know what you think about it.
Best Regard from Germany
Gold-Esel
Do you want me to analyze an other Stock on the long run, just let me know which one :-)


SNDL: Tired of seeing it dropping? We might have some good news!Hello traders and investors! Yes, SNDL is heading to our target at $ 0.95 again , which is good. In our last study, SNDL was doing some nice patterns, but unfortunately, none of them were triggered.
Now that we are close to our target at $ 0.95, we might see something interesting again. And if you missed my previous public analysis on SNDL, the link to it is below as usual.
In the daily chart, is clear the importance of the $ 0.95 , as it was a relevant resistance in the past, and it has been working as a support level now.
Since SNDL is inside a congestion , between the $ 1.64 and the $ 0.95, all I know is that when we get close to the bottom area, we should buy, and when it gets near the top level, it is time to sell.
Of course, it is not that easy, because we must wait for the right patterns to appear . For instance, the last buy opportunity on SNDL was during that Hammer pattern, which we also discussed here in my public analysis.
Now, if SNDL does anything similar, it’ll be a great buy sign. The volume is very low, indicating that it is dropping not because we have a sell-off, but because the market is weak.
What’s more, the weekly chart is looking curious:
For the first time in a very long time, SNDL is trading above the 21 ema , and what’s better, it found a support at it now.
If SNDL is about to react, now is the best moment. And if you want to keep in touch with my daily updates, remember to follow me , and please, support this idea if you liked it!
Thank you very much!


Possible yum yum style breakout for $SNDL! The chart is looking great on the 5.5 hour (333 minute) chart. Could this be a yum yum style breakout, or will it be a flop?
I have a bunch of call options with a strike price of $1.50 that expire today. Could we see a bull run within the day that brings us to $1.50, or will it be over the next few days/weeks? Either way, this seems like a tipping point to me!
We also have the new news that New York State legalized recreational cannabis for adults! Not sure how that will affect this stock!
Happy trading!
Not investment advice

SNDL most active stocksClean chart but patience is required. Can we see the green boom here soon? A break over trend line and I am in.


SNDL - How to gain followers in one easy step.Hello fellow traders; time for another analysis w/ SmoothPips
🙏 If you enjoy the analysis please make sure to leave a like and follow; so we can catch these pips together!
❓ What's unique about SmoothFX?
-All trades executed off of the same "strategy"
-Easy to read charts
-Multi Time Frame Analysis
-Learn and Earn experience
-Very high probability
-Experienced
🎯Leave some feedback & let's chat. Always willing to hear other bias'.
📌Remember; markets are moved through liquidity. We will earn more by helping each other.
🤞Please remember not every analysis will be 100% correct. Use your own due dill & discover your own research.
Sincerely,
SmoothPips
<3

Dancing on the trendline Risk/rewardThe setp up its market and sector dependent, as its all along the same neighbourhood. We need upward confirmation on any major player in the sector, cgc, tlry or cron(for mega corfimation). However this is fanteastic risk reward entry at the bottom if you are game
It is a great trade because the risk reward factor its perfect
We enter the trade at the bottom with a stop right there below 1.07, if it drops we re enter at the next support, early 90s..
Trailstop tight all the way up, but once you are out of the pennant and cross the trendline resistance, you can relax the stop to the higher dolar moves as the volatility will increase as itapproacehs and leaves each resistance.
Recoommended trade size////1000 shares just a thought
good luck!

Sndl- bottom is in!With the growth of cannabis markets it would be foolish to miss this opportunity; however I would only risk capital I am willing to lose. This way psychologically you are less likely to back out a trade. ..
With decriminalization in sights, i believe i would go as far as buying this stock for the long-term and short-term.
That being said i think my charts can speak for itself i put in several upper and lower trendlines the price action could potentially follow, if it does not follow the trendline its ok. I will reassess and not get discouraged.
never fear
Happy trades!!

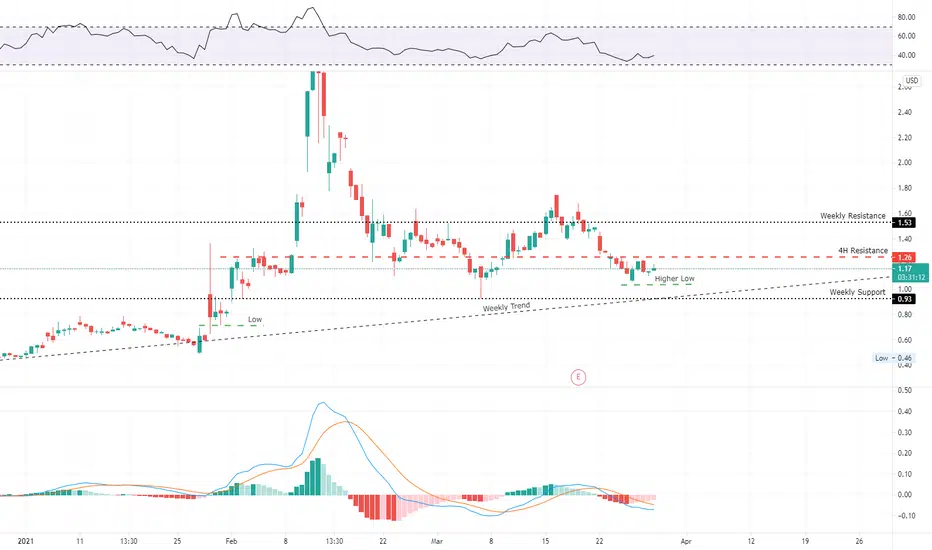
SNDL: The most important Key Points we must keep in mind!Hello traders and investors! Let’s talk about SNDL again! Since our last study, it hit our target at $ 1.25 and it lost this price level, which now seems to be working as a resistance. If you missed our last analysis, the link to it is below this post.
Ok, SNDL didn’t react around the $ 1.25, and it retested it as a resistance, following the Principle of Polarity , and we have lower highs/lows in the 1h chart. What’s more, it seems we have a purple trendline guiding the past top levels, while the 21 ema works as a resistance zone as well. Probably the trendline and the 21 ema are the most important key points for both, short and mid-term.
All of this is a clear statement that the trend is still bearish , and we have yet to see a clear reversal pattern. Now, let’s see the daily chart:
The idea of an Inverted Head & Shoulders pattern still exists, but it gets weaker as the time passes and SNDL doesn’t trigger it. It did a Piercing Line pattern (as evidenced by the blue square), but if the price loses it’s low, then the $ 0.95 is the next target for it.
We must see a good reversal pattern in the 1h chart before we see it reversing in the daily chart as well, but it seems SNDL is in a very delicate situation and whatever if it is bullish or bearish, we’ll have our answer very soon.
Remember to follow me to keep in touch with my daily studies, and if this idea helped, please, support it with your like!
Thank you very much!
