SNDL trade ideas

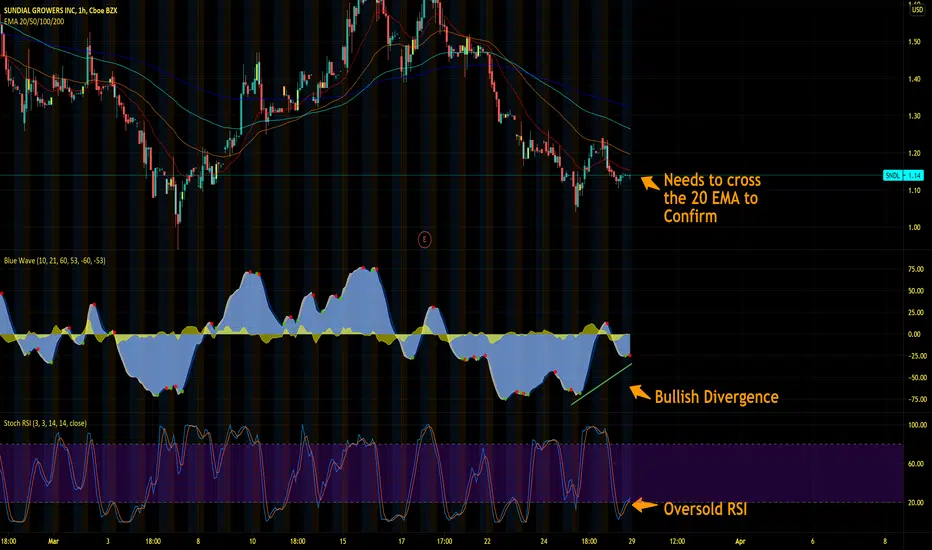
SNDL looking to get high againSNDL is setting at a decent buy zone right now.
RSI is Oversold
BlueWave has a Bullish Divergence
I would wait for it to break the 20 EMA range to have an even better confirmation to the upside.
SNDL Long Term IdeaHey everyone just a friendly reminder , I'm not a professional trader I just share my ideas in base of my opinion and experience using theories and indicators. Trade at your own risk and never buy or sell before doing your own DD.
Here in SNDL we can see in the long term run an easy way up to $7 - $8 Range. Every time the stock have a huge spike it have a drop and then it have another huge spike creating new high highs and new high lows. We can see as well candles trading above the SMA line and the EMA line is above of the SMA Line as well and that is a very good sign in this 1 Day chart for the long term. Good Luck to everyone.

Sundial Growers SNDL- Looking at a triple bottom? or is it over?Sundial Growers SNDL- Looking at a triple bottom? Don't call it a comeback!
SNDL-Repeating PatternsOn this analysis, we can clearly see the repeating patterns that SNDL been forming on its chart.
-It is pretty clear how SNDL is in love with the Ascending Triangles.
-While some triangles took days till the breakout (rise), some took months (purple triangle). So it really depends on market sentiment and investor's confidence.
-The recent big rise again followed by a nice drop which brought the potential for another Ascending Triangle formation.
-Another fact about the patterns is that every rise was followed by a bigger rise! But also every drop was bigger (in percentage) than the previous drop.
For ex: While the first 2 drops were 24% and 40% big, the next 2 ascendings had a drop of 60% and 50%. And lastly, the recent drop was 70%. So each time,
the returns are bigger, but the risks are getting bigger too!
-Currently, the length of the triangle is 1 month and 14 days. The longest time it took to break the triangle (purple triangle) was 2 months. Looks like we are going
for the 2 months long triangle formation again!
-With the given lost confidence among investors due to the market volatility and rising bonds, it is more probable that SNDL will wait for couple more weeks to fill the 2 months period for another breakout and rise.
-ATR is also getting close to its Volatility support level, but still has some space to drop. Probably will cause a little more drop in SNDL price as well.

SNDL looking goodJust a beginner looking for insight. Looks like SNDL is set to go on a long climb up?

Possible breakout situation for Sundial!This fledgling cannabis stonk has a great future ahead of it in my eyes. Just peep their instagram! They're definitely seemingly in-the-know. I'm thinking of this position as a long hold. But also will probably reach a short term peak soon.
Have fun!
Not investment advice

$SNDL Rare Emerging Weekly SmileyFace of ProfitLine emerging on the monthly chart somewhere at $6. That looks like a good target for bull cycle. Just had decent earnings come out today compared to last year, some shorts are getting squeezed too. GO APES GO!


Bearish Reversal for SUNDIAL (SNDL)We broke down from the descending triangle - bearish reversal initiated.
Need to retest $1.4 and then confirm as support again for me to be bullish.
We are now below the 50d MA on the 4H time frame - be cautious.

SNDL - Meme or TA Dream?
I know SNDL is still living in Reddit/Meme territory, but there are also some very solid technical analysis (TA) indicators that could mean we're in for another push.
Chart above has call outs for major points of consideration, but will recap here as well:
Each push that SNDL has made, comes back to the .618 retracement line (which is a pretty sizable pull back).
The most recent push has already made that pull back.
We have touched the 50 day moving average and the long term support line .
Each time in the past the 50 day moving average and support line have been touch there's a big push that follows
The only caution I see here is the overbought position on the Stochastic RSI (1 day candles). We could see a drop in the next day or two, but I don't see that impacting the over all trend. It could be another test/tap on the support line before a big push.
Lots to consider here, but it feels like we have some pretty strong bullish signs for SNDL in the coming weeks.

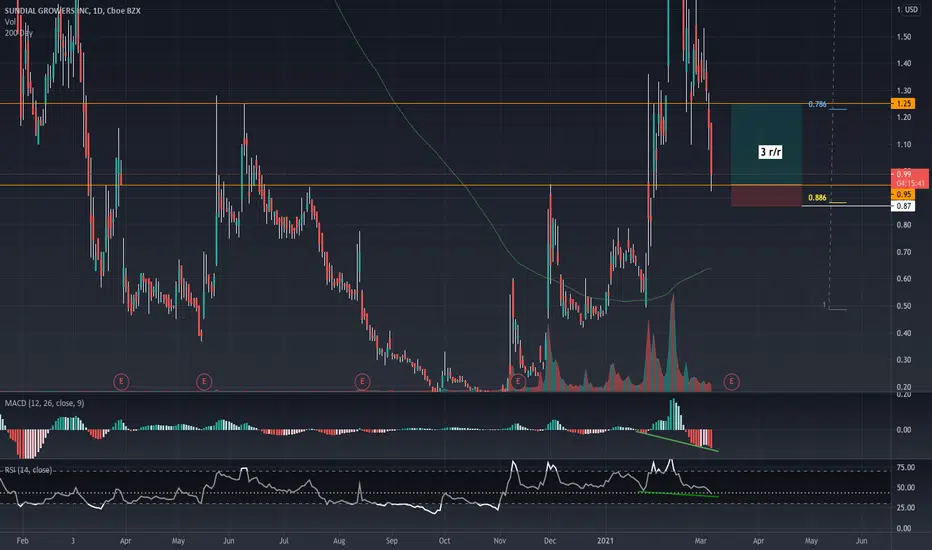
SNDLSHORT-TERM: At major support and .886 retrace, also potential hidden bullois divergence eventually (not financial advice)
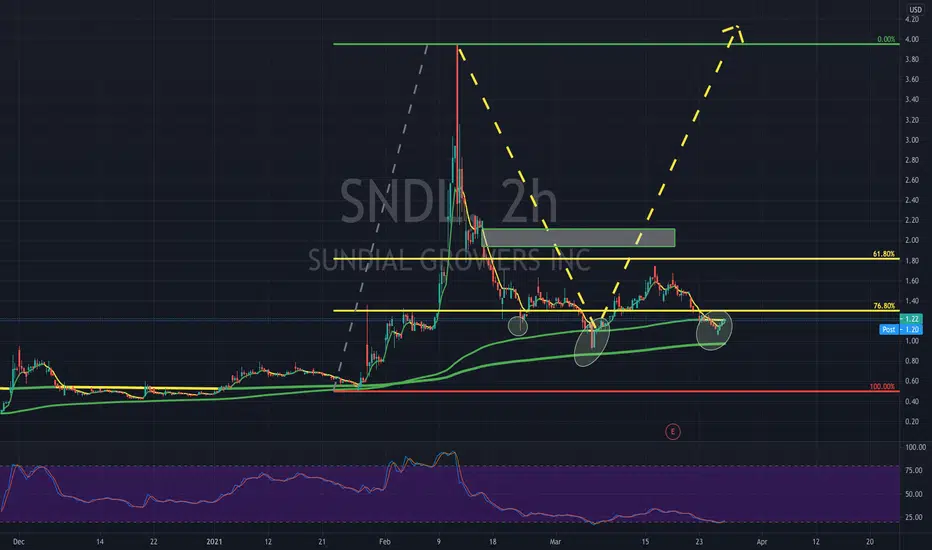
SNDL: Heading to the $ 3.96? Maybe, with 1 condition...Hello traders and investors! Again, SNDL hit the target we mentioned in our last study. Let’s see how it’ll behave now.
First, SNDL did a false breakout from the $ 1.64, and it hit our target on the same day of our last analysis, at the $ 1.47, which was a nice target to aim for, for several reasons. The link to my last public analysis is below, as usual.
Then, SNDL bounced back up to the $ 1.64 again, and it dropped. This reinforces the idea that the $ 1.64 is the most important point to keep in mind . And it is not by chance that it is the strongest resistance, and you’ll understand why when we analyze the daily chart.
But for now, keep in mind that SNDL is doing lower highs/lows, a trait of a short-term bear trend, and it seems it is heading to the $ 1.25. The earnings report did bring some volatility, but nothing as most people expected. Usually, new traders believe that the price will crash when the earnings are supposed to be bad. These people simply don't know how to apply game theory in their strategy.
Now, to the daily chart:
The $ 1.64 is the strongest resistance because it worked as a previous top in the past, and above it, there are no other meaningful resistance levels until the $ 3.96. This is why the $ 1.64 has such an important psychological meaning for SNDL.
In addition, the $ 1.64 now is a neckline, of a possible Inverted Head & Shoulders chart pattern (green area). This reinforces the idea that if SNDL defeats the $ 1.64, we’ll see it at $ 3.96, as this is the technical target for the IH&S.
The only thing we need to watch right now is if we’ll see any good candlestick/chart pattern around the $ 1.25 in the 1h chart, as this could trigger a reversal in the daily chart.
Every week I do one public analysis on SNDL, and if you want to keep in touch with my insights, remember to follow me ! And if this idea helped you, please, support it!
Thank you very much!

SNDL (NASDAQ) - Potential for BullishGreetings
Humbled, we would like to thanks for your support who has already liked, commented and followed us. Your support, strengthens us, to help in analyzing the market. If you have any questions, feel free to send us message (inbox).
Pra Trading :
- Please care for Money Management
- Have a good psychology
- Do not be hurry to open position and do not do nothing if u see opportunity
- Evaluate and upgrade your trading plan
Execution Strategy :
- Know what you want to buy, see the Fundamental
- Decide that you are on investing or speculating
- Consider what your strategy based on Investing/Speculating
- Make Road Map Of Your Trading Plan
- Decide
a. Entry strategy
b. Cut loss
c. Target of Profit
Post Trading :
a. Do not be sad if you loss or do not be very happy if you win
b. Just become a normal without emotion, Do not put emotion into your trading
c. Evaluate your trading
d. Keep on Learning
e. Be Humble
Idea :
SNDL (NASDAQ) - Potential for Bullish


$SNDL Target 2.79 for 50% Or next double level is at .93$SNDL Target 2.79 for 50%
Or next add level is at .93
I am not your financial advisor. Watch my setups first before you jump in… My trade set ups work very well and they are for my personal reference and if you decide to trade them you do so at your own risk. I will gladly answer questions to the best of my knowledge but ultimately the risk is on you. I will update targets as needed.
GL and happy trading.

Sundial Growers Stock Analysis - SNDL StockWisest Option is to hold.
Go long only if the resistance level 1.75 USD will be broken.
NASDAQ:SNDL
NASDAQ:SNDL

$SNDL (Political/Social Catalysts Approaching) Good evening or good afternoon to where ever you are?!?
Let's start off by saying that this stock has quite of few catalysts ahead of it.
(Mexico is about to legalize marijuana, which will put pressure on Biden to do the same | Medical/Political pieces you can search.)
Uruguay and other countries have seen an amazing benefit from legalizing weed one being a major decrease in crime.
Mexico is thinking of following suit of AMERICA and CANADA and legalizing weed. They're expected to draft a plan and bring it to a floor and figure out if it will be nationally or a small roll out at first.
Mexico has quite a few politicians pushing to help take away one aspect from this dangerous drug trade and just legalize weed.
Also take a look at their investor slides they Have an amazing team with a C-level suite team that comes from companies like KELLOGG's/MARS/GENERAL MILLS (google their investor slideshow for march 2021)
Look if you're waiting to scalp on this or wait for any of these catalyst, you're not going to get anything out of this. This is a long play based on some of these potential catalyst's in the future. (numbers look good too*)
I know there are quite a few institutions and investors with bigger followings posting articles that support their shorts, but weed is going to become like SODA,GUM,CHIPS, everyone is going to want to get in at some point.
The days of W.B. MASON are gone. Weed prohibition is over. The future is now old man. (sorry if you're an older gentle man or lady)
Respect peace and mad love to everyone. :D
-Wayne
This is not financial advice. This is merely an opinion piece to start an educational conversation. Do not buy and do your own due diligence.

SNDL Potential EntryPossible Entry or Short for SNDL
Variables to consider are listed on chart, I am not a financial advisor, just a man with ideas.


SNDL: Each analysis, we hit a target! Let's see what's next.Hello traders and investors! Ok, so, our analyses on SNDL have been quite precise, as it nailed another target that we talked about in my last analysis. In fact, SNDL did hit all our targets with an astonishing precision. Let’s see if we can understand what’s going on again. And of course, my last analyses on SNDL were public, and you may just check the links below for more details, if you are curious.
In the 1h chart we have what seems to be a False Breakout from the resistance at $ 1.64, as the price went above it, but couldn’t keep up and close above the black line. Now the odds are that SNDL will seek one of its supports, and a good candidate is the area between the 21 ema and the $ 1.47 (red line, previous top).
Now, the daily chart:
The thing is, we have earnings soon, and this surely will bring some volatility and could ruin the short-term reading of the charts.
But this doesn’t change the bullish bias seen here, as we have higher highs/lows in the 1h chart, and it is above the 21 ema in the daily chart, and the volume increased yesterday. This means that pullbacks are opportunities to buy.
Let’s see how SNDL will behave in the next few days. Remember to follow me to keep updated about SNDL and other stocks I analyze every day. And if this idea helped, please, support it with your like!
Thank you very much.

Sundial Growers - SNDL - Growth Sector - 2X 3X 4X play?Sundial Growers - SNDL - Growth Sector - 2X 3X 4X play? Don't tell me you got in at $1. Same with Tilray(TLRY) and Alphria(APHA) in a 'Growing' sector. Fortunes will be made through patience! Not financial Advice.

SNDL run is over but not deadI have made great money from SNDL on this recent run but the trend is going back down. "Sell in May and go away" is real and so are algorithms, take your profit or minimize your loss or you could be holding this several months. To back this up, take a look at SPY and the magnitude it is up over any moving average above 20. I will be watching this fall and following US law changes so you should keep it on your watch list regardless of this inevitable drop coming up. Look to get in early on a longer moving average bounce before November hits.
