SNDL trade ideas


Short Activity report - GreenNo shorts on sight
SO ...
Green - Happy sailing no short activity
Yellow - Some mixed activity still shorted
Red - Critical shorts that will be followed by a flash
RED FLAGs ... I will explain as they occur
Just a thought

$SNDL SHOWING A BEAUTIFUL U-PATTERN #BLESSEDPIPS Stocks looking like cryptos U pattern a few months ago. The market only repeats itself in different forms and in different markets. Be ready!!
Cannabis stocks ready to surge!!!
#BLESSEDPIPS

Bottom of a Tenbaggrrr - everything is possibleChart painting from the early 21st century, artist Maxi Scalibusa. No investment advice or a recommendation to buy or sell any securities. This is entertainment. Start 0.9700 USD

SNDL to the moonI think we crack $4 in the short term and then march onwards to $10+ maybe even $20+ by EOY.

SNDL: Will it fly again? It seems so.Hello traders and investors! Let’s see how SNDL is doing today! It has been some time since we talked about it, so we have many things to update!
First, for several months, SNDL did nothing, but now it seems it is waking up again. When it broke the resistance at $ 0.79 we had something new, and now we are in a clear bull trend with higher highs/lows.
Any pullback must be seen as an excuse to buy SNDL. Now, we are heading to its target in the daily chart :
It seems we have a rounded bottom , and some would say that this even a Cup & Handle, but this is not important. What matters is the meaning of this movement.
Right now, we have something new on SNDL, as the price is not dropping or in an accumulation anymore, and what’s even more interesting, the volume is increasing . This means that the players are excited about the stock, and technically speaking, our next target is the $ 1.75.
Let’s see if SNDL wil hit there again in the next few days. Meanwhile, remember to follow me to keep in touch with my daily updates, and support this idea if it helped you!
Thank you very much!

Sundial (SNDL) is ready just closed at $1, short squeeze ready.After a major consolidation, and posting earnings for the first time and no debt and 1 billion cash on hand this stock is ready to move to $4.

$SNDL entry PT .67-.95 Target PTs 3.80-5 and higherSundial Growers Inc. engages in production and marketing of cannabis products for the adult-use market in Canada. It produces and distributes inhalable products, such as flower, pre-rolls, and vapes. The company offers its products under the Top Leaf, Sundial Cannabis, Palmetto, and Grasslands brands. Sundial Growers Inc. was incorporated in 2006 and is headquartered in Calgary, Canada.

SNDLSundial Growers Inc (NASDAQ:SNDL) needs to take out $1.04 The break of the key resistance line with heavy volume should be the next buy point. Daily technical indicators are looking bullish. The MACD is rising above its signal line and the RSI has moved above its 60% level. Plus, the volume is trending upward over the past couple days. If 1.04 gets breached, SNDL can rise to 1.50


SNDL History Repeats Itself, Fourth "Fortune Fractal" ComingThis stock has always been a favorite of mine because it has a very solid fractal behavior.
For those who don't know, a fractal is a never-ending pattern. Fractals are infinitely complex patterns that are self-similar across different scales. They can show (and prove) the constant behavior of a stock, which in this case is SNDL. I have annotated the chart for your convenience to show the past three "fortune fractals" that have made traders a generous amount of money.
If you can zoom in on the chart, I have added three circles for each of the fractals, these are the indicators used in my strategy to ride out the fractals (called Triple-Indy). I have listed the steps below
Steps to Riding the SNDL Fortune Fractal:
1.) Look for the Price Action crossing the SMMA 7 line, but don't buy yet! This is only a signal to start paying attention. A fortune fractal could very well be on the way. (indicated by the Purple Circle)
2.) Wait for a retest at/below the SMMA 7 line. This is the moment of truth, once the Price Action bounces/breaks above the SMMA 7 line, that is the time to enter the trade. (indicated by the Green Circle).
3.) Once the RSI has peaked, that is your indication to exit the trade. More money can be made, but this is the safest point I have found that GUARANTEES profit. (indicated by the Red Circle). (3rd fractal has two exit opportunities due to ascending triangle)
4.) Extra Step - Congratulations, you just rode a SNDL fortune fractal! May your account be as green as their products. lol.
------------------------------------
"We've been to the moon three times, it's time to go back once again."
~ Capt. Moki
------------------------------------
*** I am open to discussion about this idea, the more ideas the better for the community.
***This is NOT financial advise! it is simply my own strategy/ideas for SNDL! All traders MUST do their Due Diligence and adapt this into their own trading strategies as they see fit. Happy trading!


Sundial Growers is about to reach THE major resistance 0,8 USDThe range was left to be tested and to let sundial fly away ... i would say it is a 80 % chance that sundial will reach 3,8 USD soon

SNDL SHORT POSITION SNDL jumped and is now facing resistance creating a quick short opportunity. Looking to take profit at .70

SNDL Short TermHello there,
I will open a trade from this level with a target and SL in the chart.
This trade for the short term.
*** This is not a financial advice, I'm still a beginner trying to share my Road here.
Than you.

$SNDL Potential Trade setup
Hopefully you find the chart helpful in terms of Supports & Resistance etc.
we refrain from adding commentary on the chart as that is reserved for our members and we are very conscious of not giving financial or trading advice.
Thank you for taking time to consult our chart and we would really appreciate a like, follow or comment.

SNDL CALL RUNSHORTSQUEEZE COMMENCING.
Hopefully you had the foresight to load calls at 1$ strike for late july through October

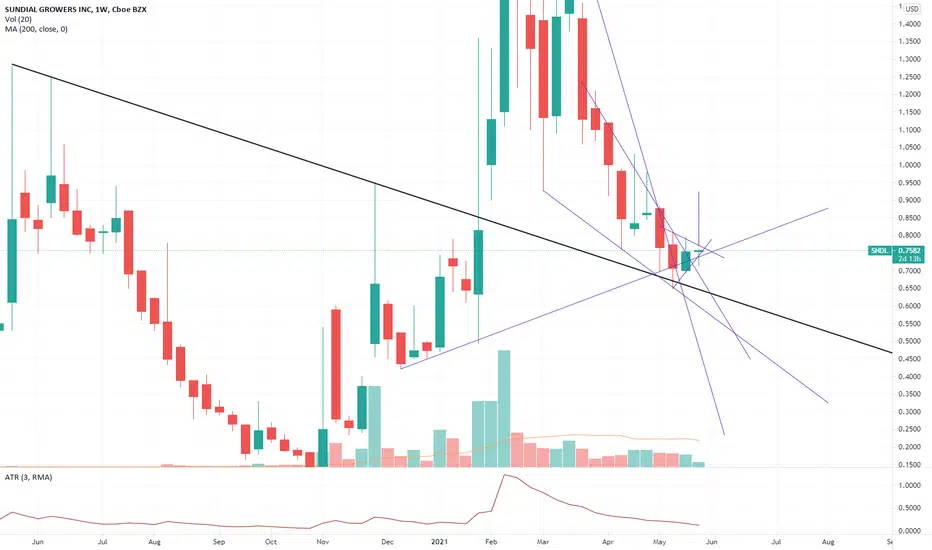
#SNDL - Weekly showing strenght and reversal signsIf we look at the weekly chart, I identified two main reasons why I consider 0.7$ being the bottom and why I think there are good chances that we can see higher levels soon:
1- Previous week candle was a piercing line candlestick pattern, with the opening below the previous candle close and with the close above the mid-body of the previous week
2- The price is reacting strongly with high volumes at the 0.72$ level, which is where most of the institutionals have their average purchasing price
In addition to this, just to estimate where the price might go by the end of this week, let's have a look at the average true range of the last 3-weeks: the price had an average extension from low to high of approximately 0.13$. This means that, starting from the assumption that the week will be a positive one, and having the low of the current week at 0.715$, this means that the price might "potentially" extend its movement up to 0.845$. This is pretty realistic and we of course hope that this will be just the beginning of the trend reversal.
Also, in the H1 chart, the head and shulder pattern that I shared few days ago, is going to complete its formation attacking the 0.795$ resistance level soon.
SUNDIAL GROWERS to the SUN ???Here are my Best and Worst case Scenarios for the promising stock SNDL. Of course the Stock can also follow the downward channel.
What are your thoughts on the idea?

SNDL Update ...beware of slow price actionChart posted 5-24-2021 at 10:35am - This has been a pain in my side.. pesky little equity lol. However I think we continue to see the support show actual "SUPPORT". The pattern that has just drawn is a bullish one and should hopefully bring us back upside to 85 cents. I think the move may be very quick.. esp as market had some positive results today. May even take place in post market, but I think this is a good sign (if it doesnt reject). Possible rejection could be 75 cents. We want to see big moves upside quickly.. if not then the failure could be just drawing us in. Yes bullish patterns can fail.. Lets just see what happens with price action. Longer than expected price action = failure...

SNDL awesome risk/reward ratio
__________________________________________________________________________________
Please like and follow us on Tradingview and Twitter , to stay up to date our latest analysis.
Check out our Website as well, for trading tools for part and full time traders.
(Check Twitter feed for currently 30% coupon for all products)
__________________________________________________________________________________
SNDL could make another north step. I recommend others often to look for a good risk/reward ration, because you will be never 100% right. This ratio looks awesome and is worth a try!

Scenario 2 is more realistic!SNDL is maybe going to touch a new support line! Im thinking its more realistic for sndl to touch 0.6$ and then take off huge!
