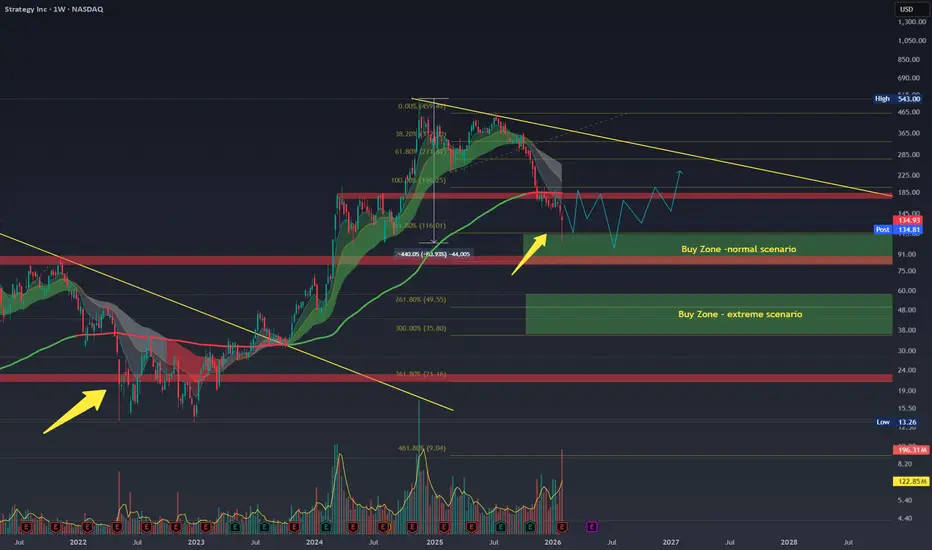
STRATEGY The collapse continues..Strategy (MSTR) completely lost its 1W MA200 (orange trend-line) last week, making its losses at more than -80% from its November 2024 All Time High (ATH), continuing to outperform even Bitcoin in losses. Given that the Bear Cycle on stocks hasn't started yet, this can only get (much) worse, somethi
Strategy Inc - 10.00% Series A Perpetual Strife Preferred Stock
No trades
Next report date
—
Report period
—
EPS estimate
—
Revenue estimate
—
−13.88 USD
−3.85 B USD
477.23 M USD
267.16 M
About Strategy Inc
Sector
Industry
CEO
Phong Q. Le
Website
Headquarters
Tyson's Corner
Founded
1989
Identifiers
3
ISIN US5949728795
Strategy, Inc. engages in the provision of enterprise analytics and mobility software. The firm designs, develops, markets, and sells software platforms through licensing arrangements and cloud-based subscriptions and related services. Its product packages include Hyper. The company was founded by Michael J. Saylor and Sanjeev K. Bansal on November 17, 1989, and is headquartered in Tysons Corner, VA.
Related stocks

MicroStrategy (MSTR) Shares Rebound After a Dramatic Sell-OffMicroStrategy (MSTR) Shares Rebound After a Dramatic Sell-Off
Shares of Strategy Incorporated (MSTR) suffered a severe collapse, falling by more than 75% from their July 2025 highs to last Thursday’s low. The main trigger was concern over the cryptocurrency market, as the company holds more than 7

$MSTR Almost Bottom
MSTR is leading indicator for CRYPTOCAP:BTC , so NASDAQ:MSTR almost bottomed out with that weekly candle, and now it will be doing time based consolidation in the next couple of months. It will give plenty of opportunity to grab even below 100 also.
RECAP - MSTR bounce from support perfectlyNo Reasonable Scenario' Forces Strategy To Sell Bitcoin As $440 Target Stands: TD Cowen
Strategy Inc (NASDAQ:MSTR) shares surged 22% Friday as TD Cowen maintained its $440 price target, arguing there is “no reasonable scenario” forcing the company to sell Bitcoin (CRYPTO: BTC) despite trading underw

MSTR at Key Support: Bounce Opportunity or Breakdown Risk?Market Structure
MSTR is trading inside a long-term descending channel, indicating that the broader trend remains bearish / corrective.
Price has recently reacted right at the lower boundary of the channel, which is a critical support zone.
The moving average is still above price, suggesting that

MSTR ¡ALERT! Important LOW on Monthly & YearlyFollow me here on TW for my regular critical updates on crypto (BTC, ETH, SOL, MSTR) and metals (GLD, SL, PL) based on Martin Armstrong's Socrates.
Look in my TW Ideas for posts of each market individually.
¡Great news for MSTR! The Daily and Weekly Stochastics are turning UP. On the MONTHLY it s

MicroStrategy Analysis: Bitcoin, Quantum Risks, and FutureMicroStrategy recently released its Q4 2025 financial results, showcasing a resilient software business. The company maintains a strong cash position while expanding its Bitcoin holdings. Revenue from enterprise analytics remains stable despite global economic shifts. However, the firm’s massive dig

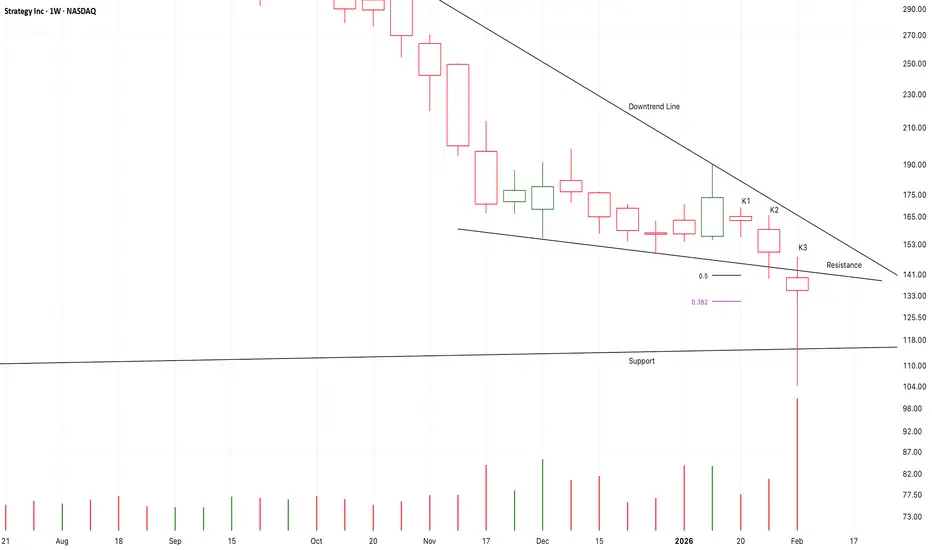
Chart Pattern Analysis Of MSTR
K3 verified a potential support here,
Perhaps it is an earlier signal of a potential bear bottom.
But it must break up the nearest downtrend line here,
And, the support must be verified by more tests.
It takes more time for a bear bottom than a bull top.
If the following candles fall to test the
MSTR: What's the strategy? If you find this information inspiring/helpful, please consider a boost and follow! Any questions or comments, please leave a comment!
Questions Waiting for Answers
MSTR at the larger degree of the Elliott Wave structure is still being resolved. What stands out is the most recent move down, which

MSTR has likely found a bottomNASDAQ:MSTR has a huge bullish engulfing candle on Friday, 26% closing at the high. CLosing at the high on a Friday is a significant move as it shows investors are confident in holding over the weekend news cycle and Bitcoin price action.
Saylor continues buying weekly including today, now loweri

See all ideas
Summarizing what the indicators are suggesting.
Oscillators
Neutral
SellBuy
Strong sellStrong buy
Strong sellSellNeutralBuyStrong buy
Oscillators
Neutral
SellBuy
Strong sellStrong buy
Strong sellSellNeutralBuyStrong buy
Summary
Neutral
SellBuy
Strong sellStrong buy
Strong sellSellNeutralBuyStrong buy
Summary
Neutral
SellBuy
Strong sellStrong buy
Strong sellSellNeutralBuyStrong buy
Summary
Neutral
SellBuy
Strong sellStrong buy
Strong sellSellNeutralBuyStrong buy
Moving Averages
Neutral
SellBuy
Strong sellStrong buy
Strong sellSellNeutralBuyStrong buy
Moving Averages
Neutral
SellBuy
Strong sellStrong buy
Strong sellSellNeutralBuyStrong buy
Displays a symbol's price movements over previous years to identify recurring trends.
US594972AT8
Strategy Inc 0.0% 01-MAR-2030Yield to maturity
—
Maturity date
Mar 1, 2030
US594972AQ4
Strategy Inc 0.625% 15-SEP-2028Yield to maturity
—
Maturity date
Sep 15, 2028
MSTR6032672
Strategy Inc 0.625% 15-MAR-2030Yield to maturity
—
Maturity date
Mar 15, 2030
MSTR6034213
Strategy Inc 0.875% 15-MAR-2031Yield to maturity
—
Maturity date
Mar 15, 2031
MSTR6242992
Strategy Inc 0.0% 01-DEC-2029Yield to maturity
—
Maturity date
Dec 1, 2029
US594972AN1
Strategy Inc 2.25% 15-JUN-2032Yield to maturity
—
Maturity date
Jun 15, 2032
See all STRF bonds
XPF
iShares S&P/TSX North American Preferred Stock Index ETF (CAD-Hedged) Trust UnitsWeight
0.48%
Market value
846.67 K
USD
Explore more ETFs
Frequently Asked Questions
The current price of STRF is 99.75 USD — it has increased by 1.53% in the past 24 hours. Watch Strategy Inc - 10.00% Series A Perpetual Strife Preferred Stock stock price performance more closely on the chart.
Depending on the exchange, the stock ticker may vary. For instance, on NASDAQ exchange Strategy Inc - 10.00% Series A Perpetual Strife Preferred Stock stocks are traded under the ticker STRF.
STRF stock has risen by 5.12% compared to the previous week, the month change is a −4.09% fall, over the last year Strategy Inc - 10.00% Series A Perpetual Strife Preferred Stock has showed a 16.60% increase.
STRF reached its all-time high on Jul 10, 2025 with the price of 127.80 USD, and its all-time low was 85.05 USD and was reached on Apr 11, 2025. View more price dynamics on STRF chart.
See other stocks reaching their highest and lowest prices.
See other stocks reaching their highest and lowest prices.
STRF stock is 2.38% volatile and has beta coefficient of 0.87. Track Strategy Inc - 10.00% Series A Perpetual Strife Preferred Stock stock price on the chart and check out the list of the most volatile stocks — is Strategy Inc - 10.00% Series A Perpetual Strife Preferred Stock there?
Today Strategy Inc - 10.00% Series A Perpetual Strife Preferred Stock has the market capitalization of 35.34 B, it has increased by 3.89% over the last week.
Yes, you can track Strategy Inc - 10.00% Series A Perpetual Strife Preferred Stock financials in yearly and quarterly reports right on TradingView.
Strategy Inc - 10.00% Series A Perpetual Strife Preferred Stock is going to release the next earnings report on May 4, 2026. Keep track of upcoming events with our Earnings Calendar.
STRF earnings for the last quarter are −42.93 USD per share, whereas the estimation was −0.08 USD resulting in a −53.56 K% surprise. The estimated earnings for the next quarter are −14.96 USD per share. See more details about Strategy Inc - 10.00% Series A Perpetual Strife Preferred Stock earnings.
Strategy Inc - 10.00% Series A Perpetual Strife Preferred Stock revenue for the last quarter amounts to 122.99 M USD, despite the estimated figure of 119.12 M USD. In the next quarter, revenue is expected to reach 117.91 M USD.
STRF net income for the last quarter is −12.44 B USD, while the quarter before that showed 2.79 B USD of net income which accounts for −546.55% change. Track more Strategy Inc - 10.00% Series A Perpetual Strife Preferred Stock financial stats to get the full picture.
Yes, STRF dividends are paid quarterly. The last dividend per share was 2.50 USD. As of today, Dividend Yield (TTM)% is 0.00%. Tracking Strategy Inc - 10.00% Series A Perpetual Strife Preferred Stock dividends might help you take more informed decisions.
Like other stocks, STRF shares are traded on stock exchanges, e.g. Nasdaq, Nyse, Euronext, and the easiest way to buy them is through an online stock broker. To do this, you need to open an account and follow a broker's procedures, then start trading. You can trade Strategy Inc - 10.00% Series A Perpetual Strife Preferred Stock stock right from TradingView charts — choose your broker and connect to your account.
Investing in stocks requires a comprehensive research: you should carefully study all the available data, e.g. company's financials, related news, and its technical analysis. So Strategy Inc - 10.00% Series A Perpetual Strife Preferred Stock technincal analysis shows the neutral today, and its 1 week rating is sell. Since market conditions are prone to changes, it's worth looking a bit further into the future — according to the 1 month rating Strategy Inc - 10.00% Series A Perpetual Strife Preferred Stock stock shows the buy signal. See more of Strategy Inc - 10.00% Series A Perpetual Strife Preferred Stock technicals for a more comprehensive analysis.
If you're still not sure, try looking for inspiration in our curated watchlists.
If you're still not sure, try looking for inspiration in our curated watchlists.