NHC head and shouldersNHC making a head and shoulders. Looks like we are in for a correction to $5.
DYOR and trade at your own risk.
Next report date
Report period
H2 2024
EPS estimate
0.17USD
Revenue estimate
592.54 MUSD
0.51USD
730.40 MUSD
1.81 BUSD
491.25 M
About NEW HOPE CORPORATION LIMITED
Sector
Industry
CEO
Robert J. Bishop
Website
Headquarters
Brisbane
Founded
1986
ISIN
AU000000NHC7
FIGI
BBG000QZM7X7
New Hope Corp. Ltd. engages in the development and operation of coal mines, port handling and logistics, agriculture, and oil and gas development and production. It operates through the following segments: Coal Mining in Queensland, Coal Mining in New South Wales, and Other. The Coal Mining in Queensland segment includes mining related exploration, development, production, processing, transportation, port operations, and marketing. The Coal Mining in New South Wales segment focuses on mining production, processing, transportation, and marketing. The Other segment refers to the coal, and oil and gas exploration, development, production and processing, pastoral operations, and administration. The company was founded in 1986 and is headquartered in Brisbane, Australia.


End of a rally?NHC below 20 MA was support now is resistance
NHC RSI Below 40
MACD Major drop to negative
Reversal 3 candle formation

NHC UPSIDE POTENTIALThis prediction is based on wave analysis, price action ,price strength and volume .

New Hope Consistently Making Higher HighsNew Hope is another coal miner similar to ASX:WHC that is just consistently posting higher highs.
Correct CODE is NHC.
Could be worth a look.

NHC coal its dirty "on the nose" atm healthly negative sentiment
get our discounted pullback in price wait from buyers to become active again. watchlisted
Perma

NHC Continuation4hr continuation here on New Hope Corp. Valid swing entry/scale in. All ASX coal miners showing strength as energy supply shortens up in Europe and Asia. Interesting to see this is showing a divvy soon. Will see how it ends up.

NHC - Trade PlanNHC has a very nice chart with impressive price action but now it seems that it may be due for a pull back because as price is going up, we can see Bearish Divergence on the RSI and MACD. The Bullish Momentum maybe running out of steam. I expect a pullback towards any of my my Buy Zones. My first Bu

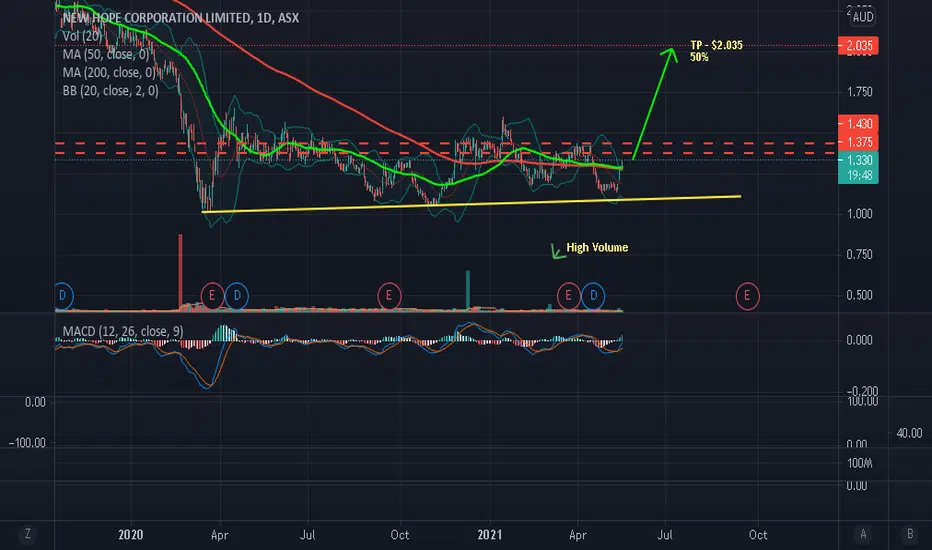
NHC - Trade PlanNHC seems to have been forming a base since start of April 2020 and I expect that this bullish price action on the Daily Timeframe is poised to continue higher. I think that it may have much upside room to go. I would be targeting the resistance area of $2.00 with a potential gain of almost 50%.
Pl
See all ideas
Trade directly on the supercharts through our supported, fully-verified and user-reviewed brokers.


Frequently Asked Questions
The current price of NHPEF is 2.98 USD — it has decreased by 1.65% in the past 24 hours. Watch New Hope Corp. Ltd. stock price performance more closely on the chart.
Depending on the exchange, the stock ticker may vary. For instance, on OTC exchange New Hope Corp. Ltd. stocks are traded under the ticker NHPEF.
New Hope Corp. Ltd. is going to release the next earnings report on Sep 17, 2024. Keep track of upcoming events with our Earnings Calendar.
NHPEF stock is 1.68% volatile and has beta coefficient of 0.76. Track New Hope Corp. Ltd. stock price on the chart and check out the list of the most volatile stocks — is New Hope Corp. Ltd. there?
NHPEF earnings for the last quarter are 0.36 USD per share, whereas the estimation was 0.32 USD resulting in a 12.77% surprise. The estimated earnings for the next quarter are 0.17 USD per share. See more details about New Hope Corp. Ltd. earnings.
New Hope Corp. Ltd. revenue for the last quarter amounts to 807.57 M USD despite the estimated figure of 772.00 M USD. In the next quarter revenue is expected to reach 522.18 M USD.
Yes, you can track New Hope Corp. Ltd. financials in yearly and quarterly reports right on TradingView.
NHPEF stock has fallen by 0.67% compared to the previous week, the month change is a 2.30% fall, over the last year New Hope Corp. Ltd. has showed a 14.37% decrease.
NHPEF net income for the last quarter is 165.19 M USD, while the quarter before that showed 281.30 M USD of net income which accounts for −41.28% change. Track more New Hope Corp. Ltd. financial stats to get the full picture.
Today New Hope Corp. Ltd. has the market capitalization of 2.62 B, it has decreased by 2.69% over the last week.
New Hope Corp. Ltd. dividend yield was 9.60% in 2023, and payout ratio reached 40.49%. The year before the numbers were 10.93% and 40.64% correspondingly. See high-dividend stocks and find more opportunities for your portfolio.
Like other stocks, NHPEF shares are traded on stock exchanges, e.g. Nasdaq, Nyse, Euronext, and the easiest way to buy them is through an online stock broker. To do this, you need to open an account and follow a broker's procedures, then start trading. You can trade New Hope Corp. Ltd. stock right from TradingView charts — choose your broker and connect to your account.
NHPEF reached its all-time high on Oct 14, 2011 with the price of 6.75 USD, and its all-time low was 0.84 USD and was reached on May 13, 2020. View more price dynamics on NHPEF chart.
See other stocks reaching their highest and lowest prices.
See other stocks reaching their highest and lowest prices.
Investing in stocks requires a comprehensive research: you should carefully study all the available data, e.g. company's financials, related news, and its technical analysis. So New Hope Corp. Ltd. technincal analysis shows the sell today, and its 1 week rating is sell. Since market conditions are prone to changes, it's worth looking a bit further into the future — according to the 1 month rating New Hope Corp. Ltd. stock shows the neutral signal. See more of New Hope Corp. Ltd. technicals for a more comprehensive analysis.
If you're still not sure, try looking for inspiration in our curated watchlists.
If you're still not sure, try looking for inspiration in our curated watchlists.
We've gathered analysts' opinions on New Hope Corp. Ltd. future price: according to them, NHPEF price has a max estimate of 4.60 USD and a min estimate of 2.30 USD. Watch NHPEF chart and read a more detailed New Hope Corp. Ltd. stock forecast: see what analysts think of New Hope Corp. Ltd. and suggest that you do with its stocks.
EBITDA measures a company's operating performance, its growth signifies an improvement in the efficiency of a company. New Hope Corp. Ltd. EBITDA is 724.40 M USD, and current EBITDA margin is 62.26%. See more stats in New Hope Corp. Ltd. financial statements.