BANKNIFTY1!Support and Resistance Levels: In technical analysis, support and resistance levels are significant price levels where buying or selling interest tends to be strong. They are identified based on previous price levels where the price has shown a tendency to reverse or find support.

BANKNIFTYBANKNIFTY closed below va
1. gapup 49300 long till 49600
2. 49300-48900 trade reversal
3. gapdown 48900 short till 48700

BANKNIFTYBANKNIFTY closed below va
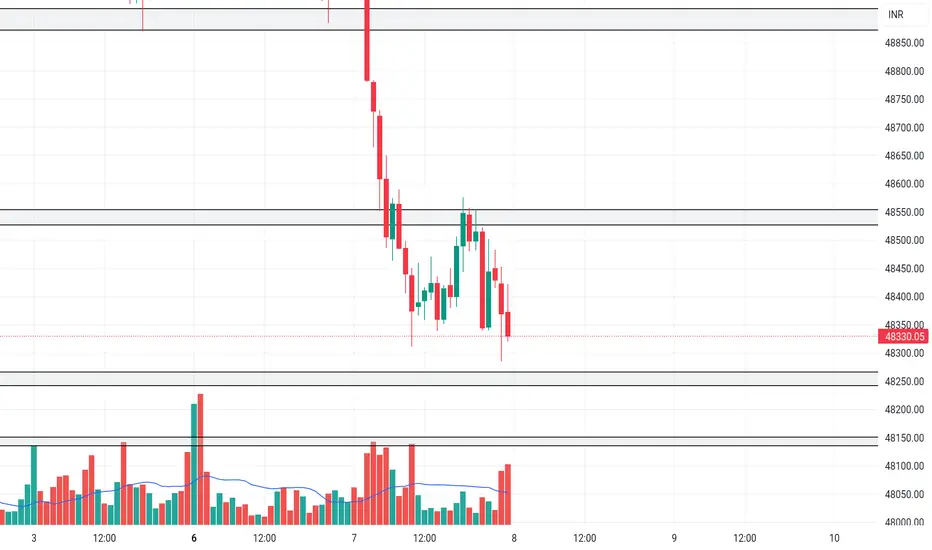
1. gapup 48550 long till 48900
2. 48550-48250 trade breakout
3. gapdown 48250 short
Retrace started, pattern is clear !A very clear and consistent HH-HL price action and measured moves down !
I believe we will see a retrace back to the TrapZone. what do you think ?

BANKNIFTYBANKNIFTY closed above va
1. gapup 49600 wait for retracement for fresh longs
2. gapdown 49100 look for longs

BANKNIFTYBANKNIFTY closed below va
1. gapup 49600 long till 49900
2.49600-49350 trade breakout
3. gapdown 49350 short

Now what ?Bank nifty in in no man's land. The close of tomorrow's candle will give us some level to mark. There seems to be decent absorption at 49580. But how strong these shorters are will be have to be seen tomorrow. Ideally a HANDLE will have to be formed for a healthy up move. Now, how big a handle?

BANKNIFTYBANKNIFTY closed below va
1. gapup 48650 long till 48800
2. 48650-48400 trade reversal
3. gapdown 48400 shorrt till 48250

Weak weak ?Will the banks be able to close this week above these crucial levels is the big question. Them Bank Nifty remains the lone crusader who never gave into this bloodbath.

BANKNIFTY BANKNIFTY closed below va
1. gapup 48050 long till 48150
2.48050-47700 trade reversal
3. gapdown 47500 short

See all ideas
A representation of what an asset is worth today and what the market thinks it will be worth in the future.
Trade directly on the supercharts through our supported, fully-verified and user-reviewed brokers.


Frequently Asked Questions
Buying or selling futures contracts depends on many factors: season, underlying commodity, your own trading strategy. So mostly it's up to you, but if you look for some certain calculations to take into account, you can study technical analysis for BANKNIFTY INDEX FUTURES. Today its technical rating is sell, but remember that market conditions change all the time, so it's always crucial to do your own research. See more of BANKNIFTY INDEX FUTURES technicals for a more comprehensive analysis.
The current price of BANKNIFTY INDEX FUTURES is 47607.25 INR — it has fallen 0.13% in the past 24 hours. Watch BANKNIFTY INDEX FUTURES price in more detail on the chart.
The volume of BANKNIFTY INDEX FUTURES is 2.03 M. Track more important stats on the BANKNIFTY INDEX FUTURES chart.
Open interest is the number of contracts held by traders in active positions — they're not closed or expired. For BANKNIFTY INDEX FUTURES this number is 2.42 M. You can use it to track a prevailing market trend and adjust your own strategy: declining open interest for BANKNIFTY INDEX FUTURES shows that traders are closing their positions, which means a weakening trend.