GEOJITFSLNSE:GEOJITFSL
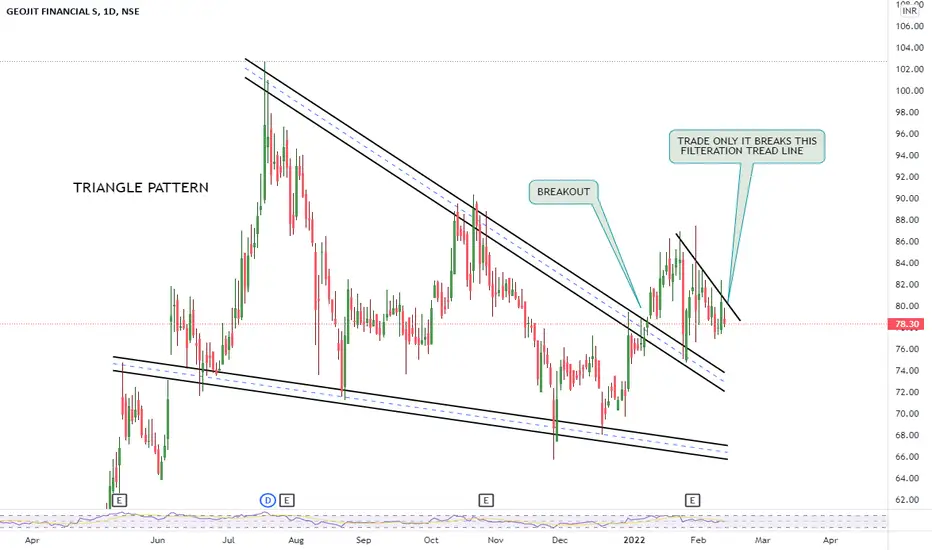
One Can Enter Now !
Or Wait for Retest of the Trendline (BO) !
Or wait For better R:R ratio !
Note :
1.One Can Go long with a Strict SL below the Trendline or Swing Low.
2. R:R ratio should be 1 :2 minimum
3. Plan as per your RISK appetite and Money Management.
Disclaimer : You
Next report date
Report period
Q1 2024
EPS estimate
—
Revenue estimate
—
6.05INR
1.45 BINR
6.24 BINR
132.61 M
About GEOJIT FINANCIAL S
Sector
Industry
CEO
Chennayappalil John George
Website
Headquarters
Kochi
Founded
1987
ISIN
INE007B01023
FIGI
BBG000BGVQD5
Geojit Financial Services Ltd. is a holding company, which offers a portfolio of savings and investment solutions. It operates through the Financial Services and Software Services segments. The Financial Services segment includes brokerage services, depository services, financial products distribution services, and portfolio management services. The Software Services segment is composed of income from development and maintenance of software. The company was founded by Chennayappalil John George and Ranajit Kanjilal in 1987 and is headquartered in Kochi, India.

GEOJITFSL CMP 93Geojit Financial Services Limited offers a complete spectrum of financial services including online broking, financial products distribution, portfolio management services, margin funding, etc.
Market Cap - ₹ 2,225 Cr.
Stock P/E - 18.1
Inverted Head & Shoulders Pattern formed

GEOJITFS Long PositionalBuy GEOJITFS above 99
for the Target of 106-145-210
SL 66
Strategy : BO + RSI > 60 + EMA above 20 & 50
Duration few Weeks
Remember there may be some retracement so accumulate more

GEOJITFSL - Geojit Financial S - An Opportunity to BuyAs per previous chart history and present chart pattern, an opportunity is seen to buy this stock above 89 or wait for a strong pullback from the no trading zone as mentioned on the chart
Buy Above 88
Sell at 110
Do your own research before buying this stock as I am not SEBI registered person
T

💥Geojit Financial Services💥-Nice Breakout💥Geojit Financial Services💥-Nice Breakout
Capital to be deployed- 20k
Investing Price-72-75
Breakout Price-72
Stoploss-59
Targets-95-107-177
RT for max reach
#geojit #stockstowatch #StocksToBuy #StocksInFocus #stocks #StockMarket

GEOJITFSL towards 100- Good fundamentals
- Net profit rising
- 52W breakout with volume
- EMA crossover
Buy between 65 and 67 targeting 100rs..


GEOJITFSLNSE:GEOJITFSL
Please note that we are not a SEBI Registered Investor Adviser/PMS/ Broking House.
All the contents over here are for educational purposes only and are not investment advice or recommendations
offered to any person(s) with respect to the purchase or sale of the stocks / futures and
GEOJIT FINANCIALSDemat account opening is at life time high , this is the broker in south india. cmp: 78.05

GeojitGeojit Etihasik teji wala share
.........................................................
..........................
See all ideas
Trade directly on the supercharts through our supported, fully-verified and user-reviewed brokers.


Frequently Asked Questions
The current price of GEOJITFSL is 105.30 INR — it has decreased by 1.27% in the past 24 hours. Watch GEOJIT FINANCIAL S stock price performance more closely on the chart.
Depending on the exchange, the stock ticker may vary. For instance, on NSE exchange GEOJIT FINANCIAL S stocks are traded under the ticker GEOJITFSL.
GEOJIT FINANCIAL S is going to release the next earnings report on Jul 31, 2024. Keep track of upcoming events with our Earnings Calendar.
GEOJITFSL stock is 7.07% volatile and has beta coefficient of 0.08. Track GEOJIT FINANCIAL S stock price on the chart and check out the list of the most volatile stocks — is GEOJIT FINANCIAL S there?
Yes, you can track GEOJIT FINANCIAL S financials in yearly and quarterly reports right on TradingView.
GEOJITFSL stock has risen by 12.02% compared to the previous week, the month change is a 39.01% rise, over the last year GEOJIT FINANCIAL S has showed a 138.51% increase.
GEOJITFSL net income for the last quarter is 505.80 M INR, while the quarter before that showed 368.90 M INR of net income which accounts for 37.11% change. Track more GEOJIT FINANCIAL S financial stats to get the full picture.
Today GEOJIT FINANCIAL S has the market capitalization of 25.19 B, it has increased by 19.86% over the last week.
Yes, GEOJITFSL dividends are paid annually. The last dividend per share was 1.50 INR. As of today, Dividend Yield (TTM)% is 1.42%. Tracking GEOJIT FINANCIAL S dividends might help you take more informed decisions.
GEOJIT FINANCIAL S dividend yield was 2.33% in 2023, and payout ratio reached 24.75%. The year before the numbers were 3.76% and 36.90% correspondingly. See high-dividend stocks and find more opportunities for your portfolio.
Like other stocks, GEOJITFSL shares are traded on stock exchanges, e.g. Nasdaq, Nyse, Euronext, and the easiest way to buy them is through an online stock broker. To do this, you need to open an account and follow a broker's procedures, then start trading. You can trade GEOJIT FINANCIAL S stock right from TradingView charts — choose your broker and connect to your account.
GEOJITFSL reached its all-time high on Oct 11, 2017 with the price of 147.05 INR, and its all-time low was 8.85 INR and was reached on Jul 7, 2005. View more price dynamics on GEOJITFSL chart.
See other stocks reaching their highest and lowest prices.
See other stocks reaching their highest and lowest prices.
Investing in stocks requires a comprehensive research: you should carefully study all the available data, e.g. company's financials, related news, and its technical analysis. So GEOJIT FINANCIAL S technincal analysis shows the buy rating today, and its 1 week rating is strong buy. Since market conditions are prone to changes, it's worth looking a bit further into the future — according to the 1 month rating GEOJIT FINANCIAL S stock shows the strong buy signal. See more of GEOJIT FINANCIAL S technicals for a more comprehensive analysis.
If you're still not sure, try looking for inspiration in our curated watchlists.
If you're still not sure, try looking for inspiration in our curated watchlists.
EBITDA measures a company's operating performance, its growth signifies an improvement in the efficiency of a company. GEOJIT FINANCIAL S EBITDA is 2.21 B INR, and current EBITDA margin is 35.44%. See more stats in GEOJIT FINANCIAL S financial statements.