MARKET SAARTHI- STRONG BUY EXPLAINEDstrong buy @ max resistance area is level of highest resistance a script is likely to face from previous days of price action, though not computed those ways but in most cases, it represents the zone of call writers, historic resistance (in time frame u are trading) could bring reversal once we have
85.30INR
68.27 BINR
1.17 TINR
362.43 M
About GRASIM INDUSTRIES
Sector
Industry
CEO
Hari Krishna Agarwal
Website
Headquarters
Mumbai
Employees (FY)
43.13 K
Founded
1947
ISIN
IN9047A01011
FIGI
BBG01KXM82J6
Grasim Industries Ltd. engages in the production of chemicals and cement. It operates through the following segments: Viscose, Chemicals, Cement, Financial Services, and Others. The Viscose Staple Fibre segment offers wood pulp and yarn. The Chemicals segment produces caustic soda, allied chemicals, and epoxy. The Cement segment provides grey cement, white cement, and allied products. The Financial Services segment is responsible for the non-bank financial services, life insurance services, housing finance, private equity, equity and commodity broking, wealth management, general insurance advisory, and health insurance. The Others segment relates to textiles, insulators, agri-business and solar power. The company was on August 25, 1947 and is headquartered in Mumbai, India.

Grasim Long PositionalBuy Grasim above 2147
Target of 2209-2487-3043
SL 1959
Strategy : SBO + RSI > 60 + EMA above 20 & 50
Duration few weeks
Please consult your financial advisor before investing
All research for educational purposes only.
Stock is ready to cross past barriers with good volumes

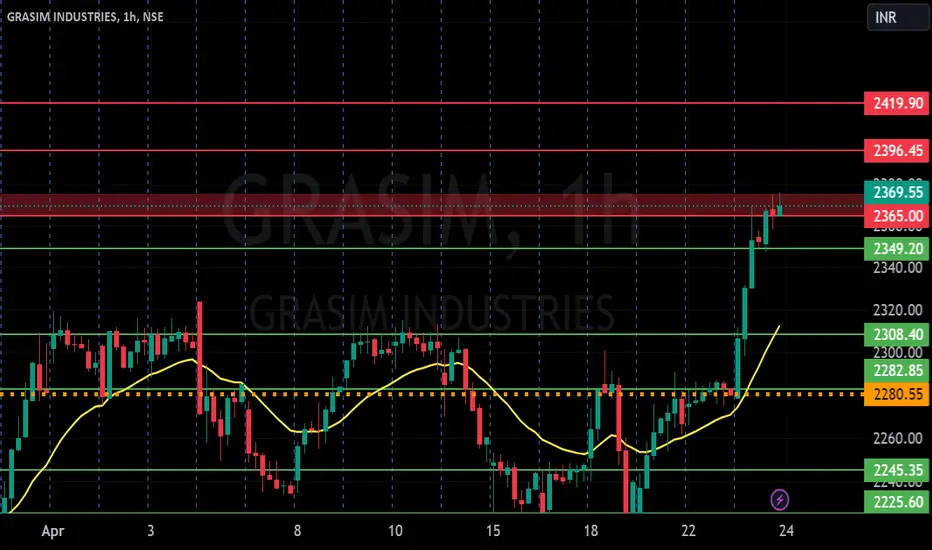
SWING IDEA - GRASIM
Strong breakout on weekly TF
formed a flag and pole pattern which is a continuation pattern
a strong up move expected after a thorough consolidation
SL - 1856
TARGET - 2300 // 2320

GRASIM INDUSTRIES S/RSupport and Resistance Levels: In technical analysis, support and resistance levels are significant price levels where buying or selling interest tends to be strong. They are identified based on previous price levels where the price has shown a tendency to reverse or find support.
Support levels ar
Grasim - Potential UpsideLTP on NSE on 23/Feb/2024 was INR 2,190/- (with a high of INR 2,236.70 and a low of INR 2,182.60)
Although it is a good buy at current levels, conservatively I would still accumulate it around INR 2,060/- - 2,080/- zone.
Resultantly after all this discussion, I believe that the target price should b

GRASIM GRASIM looks good for mid -term.
GRASIM BUY
CMP-1933
TARGET- 2000/2070/2200+
SL BELOW-1900
#MIDTERM

Grasim trade setupBroadning decending wedge is a bullish pattern
2 probabilities, one is beariah as we can see a divergence in RSI. Second one is bullish as this pattern is a bullish pattern.
Once the wedge is broken upside we get to see those targets .. or if it continues in the range we get to see the bottom sup

GRASIM INDUSTRIES S/R for 1/4/24Support and Resistance Levels: In technical analysis, support and resistance levels are significant price levels where buying or selling interest tends to be strong. They are identified based on previous price levels where the price has shown a tendency to reverse or find support.
Support levels ar

Grasim IndustruesHas given a long term trendline and Gann level BO at 2194 where SL can be placed just below this level
Can reach the marked targets as given in the graph.

GRASIMNSE:GRASIM
One Can Enter Now ! Or Wait for Retest of the Trendline (BO) Or wait For better R:R ratio
Note :
1.One Can Go long with a Strict SL below the Trendline or Swing Low of Daily Candle.
2. Close, should be good and Clean.
3. R:R ratio should be 1 :2 minimum
4. Plan as per your RISK appe

See all ideas
Trade directly on the supercharts through our supported, fully-verified and user-reviewed brokers.


Frequently Asked Questions
The current price of GRASIMPP.E1 is 1150.10 INR — it has decreased by 1.72% in the past 24 hours. Watch GRASIM INDUSTRIES LTD stock price performance more closely on the chart.
Depending on the exchange, the stock ticker may vary. For instance, on NSE exchange GRASIM INDUSTRIES LTD stocks are traded under the ticker GRASIMPP.E1.
GRASIMPP.E1 stock has risen by 4.08% compared to the previous week, the month change is a 10.59% rise, over the last year GRASIM INDUSTRIES LTD has showed a 54.79% increase.
GRASIMPP.E1 reached its all-time high on May 3, 2024 with the price of 1217.85 INR, and its all-time low was 743.00 INR and was reached on Feb 9, 2024. View more price dynamics on GRASIMPP.E1 chart.
See other stocks reaching their highest and lowest prices.
See other stocks reaching their highest and lowest prices.
GRASIMPP.E1 stock is 2.80% volatile and has beta coefficient of 3.32. Track GRASIM INDUSTRIES LTD stock price on the chart and check out the list of the most volatile stocks — is GRASIM INDUSTRIES LTD there?
Today GRASIM INDUSTRIES LTD has the market capitalization of 1.66 T, it has increased by 1.73% over the last week.
Yes, you can track GRASIM INDUSTRIES LTD financials in yearly and quarterly reports right on TradingView.
GRASIMPP.E1 net income for the last quarter is 15.14 B INR, while the quarter before that showed 11.64 B INR of net income which accounts for 30.13% change. Track more GRASIM INDUSTRIES LTD financial stats to get the full picture.
No, GRASIMPP.E1 doesn't pay any dividends to its shareholders. But don't worry, we've prepared a list of high-dividend stocks for you.
As of May 22, 2024, the company has 43.13 K employees. See our rating of the largest employees — is GRASIM INDUSTRIES LTD on this list?
EBITDA measures a company's operating performance, its growth signifies an improvement in the efficiency of a company. GRASIM INDUSTRIES LTD EBITDA is 328.29 B INR, and current EBITDA margin is 24.33%. See more stats in GRASIM INDUSTRIES LTD financial statements.
Like other stocks, GRASIMPP.E1 shares are traded on stock exchanges, e.g. Nasdaq, Nyse, Euronext, and the easiest way to buy them is through an online stock broker. To do this, you need to open an account and follow a broker's procedures, then start trading. You can trade GRASIM INDUSTRIES LTD stock right from TradingView charts — choose your broker and connect to your account.