Get this as soon as possible Get this as soon as possible yes you heard me right ..
Expectations se b upar h ye stock
Fundamentals are amazing
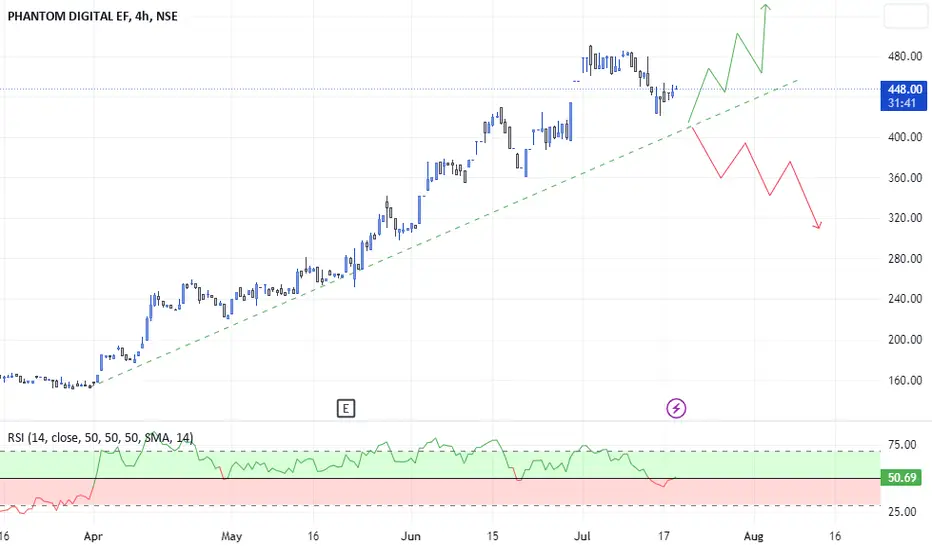
Chart is superb
Pattern is bullish
So buy this or see yourself regreting later on
Because i am buying this
Brief:
Cmp 538
Buy at cmp
Avg near 420-470
TGT 800-1000++
Sl - Can be pla
21.00INR
161.96 MINR
578.94 MINR
About PHANTOM DIGITAL EF
Sector
Industry
CEO
Bejoy Arputharaj Sam Manohar
Website
Headquarters
Chennai
Employees (FY)
437
Founded
2011
ISIN
INE0MLZ01019
FIGI
BBG01B02GQZ6
Phantom Digital Effects Ltd. is a visual effects studio for films, web series, and commercials. It offers three-dimensional (3D) elements, photoreal creatures, and environments; rig/wire removal, paint cleanup, and rotoscopy; and 3D animations. The company ws founded in 2011 and is headquartered in Chennai, India.

Phantom Digital Effects Phantom Digital Effects Limited is a Certified Trusted Partner Network (TPN) company, a full-fledged creative VFX studio, based in India with offices operating in US and Canada. As a TPN Certified studio, PhantomFX offers a wide range of VFX services

Phantom Digital Effects Ltd *Phantom Digital Effects Ltd.*
P&F Formation on Weekly Basis
Price BreakOut >481 Needed/Sustained
Then Good to Go.
Vol. Consolidation. Continued BuiltUp Required. To be Watched.
Trail SL with Upside.
Book Profit as per Risk Appetite.
Do Your Own Research as well. This is an Opinion.
Happy Invest

Trendline Holding will Keep this ContiueHI @JainArpan
With this Chart your queries ends Hope it helps All the Chart I posted as per my knowledge Please Do your Due Diligence.
Crypto will be answered later on.
All the best.
Gratify if you appreciate the practice then you can like it, share it and
If you want me to investigate any chart
See all ideas
Trade directly on the supercharts through our supported, fully-verified and user-reviewed brokers.


Frequently Asked Questions
The current price of PHANTOMFX is 467.10 INR — it has decreased by 6.31% in the past 24 hours. Watch PHANTOM DIGITAL EF stock price performance more closely on the chart.
Depending on the exchange, the stock ticker may vary. For instance, on NSE exchange PHANTOM DIGITAL EF stocks are traded under the ticker PHANTOMFX.
Yes, you can track PHANTOM DIGITAL EF financials in yearly and quarterly reports right on TradingView.
PHANTOMFX stock has fallen by 6.87% compared to the previous week, the month change is a 4.07% fall, over the last year PHANTOM DIGITAL EF has showed a 85.87% increase.
PHANTOMFX net income for the last quarter is 77.96 M INR, while the quarter before that showed 43.47 M INR of net income which accounts for 79.36% change. Track more PHANTOM DIGITAL EF financial stats to get the full picture.
No, PHANTOMFX doesn't pay any dividends to its shareholders. But don't worry, we've prepared a list of high-dividend stocks for you.
Like other stocks, PHANTOMFX shares are traded on stock exchanges, e.g. Nasdaq, Nyse, Euronext, and the easiest way to buy them is through an online stock broker. To do this, you need to open an account and follow a broker's procedures, then start trading. You can trade PHANTOM DIGITAL EF stock right from TradingView charts — choose your broker and connect to your account.
PHANTOMFX reached its all-time high on Aug 7, 2023 with the price of 593.45 INR, and its all-time low was 151.00 INR and was reached on Mar 24, 2023. View more price dynamics on PHANTOMFX chart.
See other stocks reaching their highest and lowest prices.
See other stocks reaching their highest and lowest prices.
As of May 2, 2024, the company has 437.00 employees. See our rating of the largest employees — is PHANTOM DIGITAL EF on this list?
Investing in stocks requires a comprehensive research: you should carefully study all the available data, e.g. company's financials, related news, and its technical analysis. So PHANTOM DIGITAL EF technincal analysis shows the sell today, and its 1 week rating is sell. Since market conditions are prone to changes, it's worth looking a bit further into the future — according to the 1 month rating PHANTOM DIGITAL EF stock shows the buy signal. See more of PHANTOM DIGITAL EF technicals for a more comprehensive analysis.
If you're still not sure, try looking for inspiration in our curated watchlists.
If you're still not sure, try looking for inspiration in our curated watchlists.
EBITDA measures a company's operating performance, its growth signifies an improvement in the efficiency of a company. PHANTOM DIGITAL EF EBITDA is 338.73 M INR, and current EBITDA margin is 39.18%. See more stats in PHANTOM DIGITAL EF financial statements.