Next report date
—
Report period
—
EPS estimate
—
Revenue estimate
—
23.80INR
939.00 MINR
44.69 BINR
10.49 M
About HITACHI ENERGY IND
Sector
Industry
CEO
Venu Nuguri
Website
Headquarters
Bangalore
Employees (FY)
2.94 K
Founded
2019
ISIN
INE07Y701011
FIGI
BBG00ST5VSW4
Hitachi Energy India Ltd. engages in manufacture of electrical equipment. Its products and solutions support utility, industry and transport and infrastructure customers to plan, build, operate and maintain its power infrastructure. The company was founded on February 19, 2019 and is headquartered in Bangalore, India.

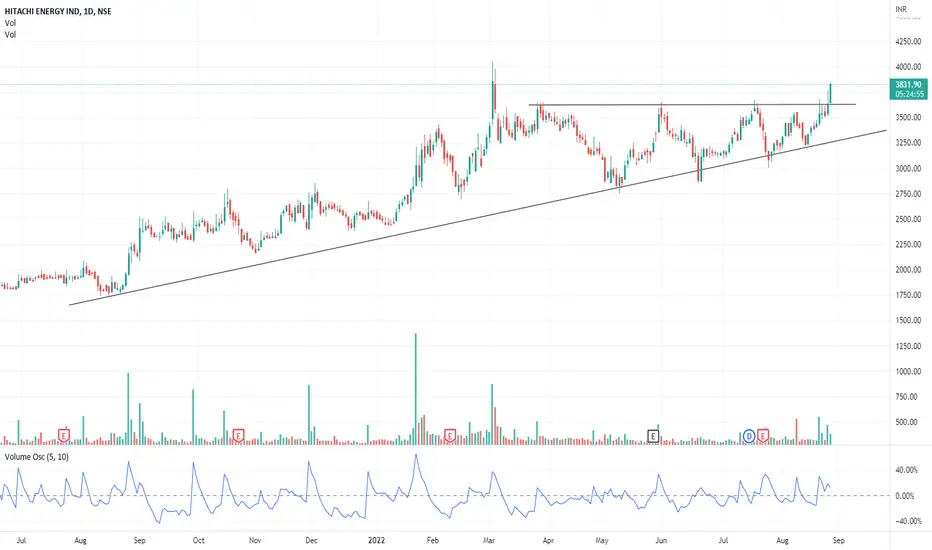
Hitachi Energy-Nice breakoutHitachi Energy-Nice breakout.
Capital to be deployed- 20k
Investing Price -4250-4270
Breakout Price -4234
Stoploss-3790
Targets-5568-6011
#hitachi #StocksToBuy #StockMarket #StockToWatch #StocksInFocus #stockstowatch


POWERINDIA POWERINDIA - Confluence of weekly channel support and demand zone.
The stock has a high scalable business and good fundamentals.
One can add with a SL of today's low.

STOCK ANALYSIS POWER INDIA LTD FOR ONE MONTHgood evening friends stock is forming M pattern and can show donwward journey if not sustain above 3430 that ath level.
See video for detailed analysis.

powerindia potencial 10 to 20 %see chart for technical
result is coming and chart is giving bullish pattern
may be if breakout happens then it can give 10 to 20 %
happy trading ,
Samkit Jain

Hitachi India BreakoutThe stock has broken out and retested, therefore may undergo a reversal rally. Trade is supported by brokerage calls and Supports Nearby.
Risk Reward Ratio - 3:1
SL is placed below support zone & the lower trendline. The target is placed near resistance.

POWER INDIA POWER INDIA - High strength structure
Look at the following points -
1. Shakeout at all time high to remove the weak longs.
2. Retest of the previous breakout structure
3. Fresh all time closing.
This strong stood strong during a correction. The odds of out performance are high here.

POWER INDIA ENTRY SETUP 1:3🎯🔥NSE:POWERINDIA Broke out of an ascending channel pattern. Price gave excellent momentum during breakout but it witnessed heavy selling pressure during market hours.
As a result, price left huge wick behind. Script should consolidate for some days before the next momentum candle because of the huge

See all ideas
Trade directly on the supercharts through our supported, fully-verified and user-reviewed brokers.


Frequently Asked Questions
The current price of POWERINDIA is 8963.00 INR — it has increased by 0.46% in the past 24 hours. Watch HITACHI ENERGY IND stock price performance more closely on the chart.
Depending on the exchange, the stock ticker may vary. For instance, on NSE exchange HITACHI ENERGY IND stocks are traded under the ticker POWERINDIA.
HITACHI ENERGY IND is going to release the next earnings report on May 29, 2024. Keep track of upcoming events with our Earnings Calendar.
POWERINDIA stock is 3.48% volatile and has beta coefficient of −0.08. Track HITACHI ENERGY IND stock price on the chart and check out the list of the most volatile stocks — is HITACHI ENERGY IND there?
POWERINDIA earnings for the last quarter are 5.40 INR per share, whereas the estimation was 16.20 INR resulting in a −66.67% surprise. The estimated earnings for the next quarter are 16.16 INR per share. See more details about HITACHI ENERGY IND earnings.
HITACHI ENERGY IND revenue for the last quarter amounts to 12.74 B INR despite the estimated figure of 12.71 B INR. In the next quarter revenue is expected to reach 15.01 B INR.
Yes, you can track HITACHI ENERGY IND financials in yearly and quarterly reports right on TradingView.
POWERINDIA stock has fallen by 6.39% compared to the previous week, the month change is a 18.71% rise, over the last year HITACHI ENERGY IND has showed a 139.40% increase.
POWERINDIA net income for the last quarter is 229.70 M INR, while the quarter before that showed 247.40 M INR of net income which accounts for −7.15% change. Track more HITACHI ENERGY IND financial stats to get the full picture.
Today HITACHI ENERGY IND has the market capitalization of 377.72 B, it has increased by 12.21% over the last week.
Yes, POWERINDIA dividends are paid annually. The last dividend per share was 3.40 INR. As of today, Dividend Yield (TTM)% is 0.04%. Tracking HITACHI ENERGY IND dividends might help you take more informed decisions.
HITACHI ENERGY IND dividend yield was 0.10% in 2022, and payout ratio reached 15.35%. The year before the numbers were 0.09% and 6.25% correspondingly. See high-dividend stocks and find more opportunities for your portfolio.
Like other stocks, POWERINDIA shares are traded on stock exchanges, e.g. Nasdaq, Nyse, Euronext, and the easiest way to buy them is through an online stock broker. To do this, you need to open an account and follow a broker's procedures, then start trading. You can trade HITACHI ENERGY IND stock right from TradingView charts — choose your broker and connect to your account.
POWERINDIA reached its all-time high on May 2, 2024 with the price of 9989.85 INR, and its all-time low was 680.00 INR and was reached on Mar 30, 2020. View more price dynamics on POWERINDIA chart.
See other stocks reaching their highest and lowest prices.
See other stocks reaching their highest and lowest prices.
As of May 9, 2024, the company has 2.94 K employees. See our rating of the largest employees — is HITACHI ENERGY IND on this list?
Investing in stocks requires a comprehensive research: you should carefully study all the available data, e.g. company's financials, related news, and its technical analysis. So HITACHI ENERGY IND technincal analysis shows the buy rating today, and its 1 week rating is buy. Since market conditions are prone to changes, it's worth looking a bit further into the future — according to the 1 month rating HITACHI ENERGY IND stock shows the buy signal. See more of HITACHI ENERGY IND technicals for a more comprehensive analysis.
If you're still not sure, try looking for inspiration in our curated watchlists.
If you're still not sure, try looking for inspiration in our curated watchlists.
We've gathered analysts' opinions on HITACHI ENERGY IND future price: according to them, POWERINDIA price has a max estimate of 8250.00 INR and a min estimate of 4200.00 INR. Watch POWERINDIA chart and read a more detailed HITACHI ENERGY IND stock forecast: see what analysts think of HITACHI ENERGY IND and suggest that you do with its stocks.
EBITDA measures a company's operating performance, its growth signifies an improvement in the efficiency of a company. HITACHI ENERGY IND EBITDA is 2.62 B INR, and current EBITDA margin is 6.31%. See more stats in HITACHI ENERGY IND financial statements.