Tata Chemicals ready for more 8-10% moveTata chemicals has given trendline breakout
Possibility of more 8-10% move is possible
TATACHEM trade ideas

TATACHEMNSE:TATACHEM
One Can Enter Now ! Or Wait for Retest of the Trendline (BO) Or wait For better R:R ratio
Note :
1.One Can Go long with a Strict SL below the Trendline or Swing Low of Daily Candle.
2. Close, should be good and Clean.
3. R:R ratio should be 1 :2 minimum
4. Plan as per your RISK appetite
Disclaimer : You are responsible for your Profits and loss, Shared for Educational purpose
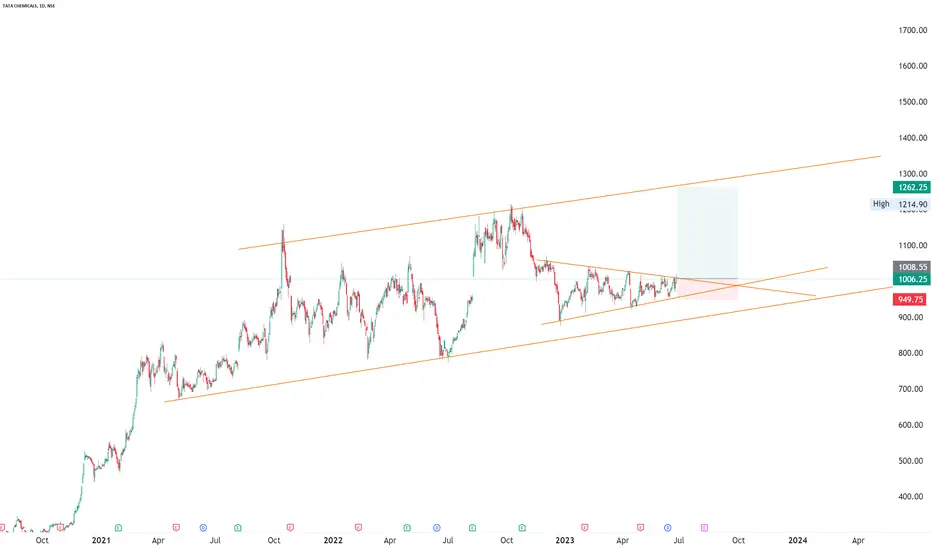
Symmetrical Triangle Pattern in TATA CHEMICALSKeep a close eye on TATA CHEMICALS.
The stock is trading in a symmetrical triangle.
The symmetrical triangle pattern is usually a neutral pattern.
Breakout will be bullish
Breakdown will be bearish.
I Will share entry, stop loss and target levels once, the breakout/breakdown happens.

buy tatachem @ 970 Target 989.90,995, 1006 ascending trianglebuy tatachem @ 970 Target 989.90,995, 1006
ascending triangle formation
risk reward 1.73
sl @ 950.50

Tatachem- Good risk to Reward ratio for going longLong NSE:TATACHEM Cash with 990 with Sl of 910.
accumulation is about to over a strong support on 960 stock is ready to blast.
Target 1: 1075
Target 2: 1200
Target3: 1500

TATA CHEMICALS TRIANGLE PATTERN swing trade take trade when nifty turns bullish swing trade perfect symmetrical triangle short term opportunity for upside take trade after breakout from the trendline according to own risk this is not call just a analysis.

TATA Chemicals NSE:TATACHEM
The firm’s consolidated net profit hiked by 53% to Rs 711 crore in the March quarter, while revenue from operations leaped by 27% to Rs 4,407 crore. It's alright hyped on monthly timeframe. On weekly it can touch the previous high. But for now it appears to be range bound.
Trading setup of 10% gains incoming.
*Not a financial advice.
My charts speaks louder than words.
I'm a chartist and I paint charts.

Tata Chem can fall 5%its broken the prev low and trying to accumulate PEs on 1st level of Fib now.
tgt is 1 and 2nd levels of Fib below the bottom line.

Tata chem - @50% retrace and support zone. Tata chem is at 50% retrace of the rally from june to october and also entering a support zone
Worth looking for positional longs here. SL on close below 950

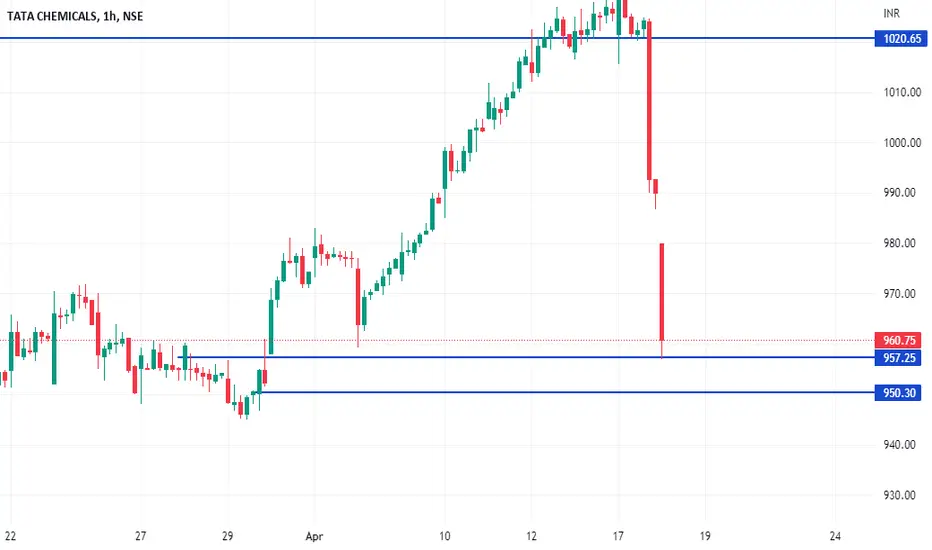
TATACHEM near TRENDLINE BREAKOUTWe saw 30% Correction from the All Time High price & The price facing Downward trendline resistance and now very near to breakout level of trendline. If price breaks the level 990 and closes than price will head towards the target of 1015/1040+ & If price closes above the 1055 than we can see targets of 1100/1200+. The Support zone between the 940--920. Price Breakdown below the 920 and closes than target will be 900/870+
Traders, if you liked this idea or if you have your own opinion about it, write in the comments. I will be glad.

Tata chem looking good for buyTata Chemical recently breakout through the resistance trendline. Looking for a buy setup after retesting or keep SL logical for aggressive investment

Tata Chemical Dobule BottomDouble bottom in TATA chemical with pinbar at support
above 850 can do 900, 940 or more
-Saptarish_Trading

TATACHEM Inside bar + Trend line supportTATACHEM Inside bar + Trend line support
Bullish
Entry: 994
Target 1 : 1030
SL: 961

#TATACHEM Next Upper Targets.Closing above 997--1000 Tredline Breakout. Above 1000 next target will be 1015 & If Price holds at upper levels than we can
expect upper target of 1056 & 1143.

Tata Chemicals daily report shows triangle pattern breakout.Tata Chemicals on Daily Chart:
Triangle Pattern Breakout: The stock has seen a triangle pattern breakout on the daily time frame, which may indicate a potential price move in either direction.
Mean (EMA) Diversion on Hourly time frame: The mean (EMA) has diverged on the hourly time frame, which may indicate a change in the trend of the stock price.
Resistance/Target: The stock may face resistance at levels of 1060, 1108, and 1176. These levels may act as a barrier to the stock price's upward movement.
Support: The stock may find support at levels of 948 and 912. These levels may act as a floor for the stock price and may provide some stability during times of market volatility.
In conclusion, the daily report suggests that the stock may experience some price volatility in the near term, with potential for both upward and downward price moves. As always, it is recommended to monitor the stock closely and consider risk management strategies when investing.

Tata chemical ShortDisclaimer :- We are not SEBI Register Analyst This content is only for educational purpose . We will not responsible for your profits / loss . Please consult your financial advisor before taking any decision - BUY / SELL

TATA Chemical Selling Area--------------------------------------DISCLIMER--------------------------------------------------
* All the information shared in this chart is provided for strictly educational purposes only.
* This chart is sharing information are based on the theory of technical analysis .
* This is not an offer to buy or sell stocks, futures , options, commodity, forex, interests or any other trading security.
* Back test yourself before jump into live market consult your financial adviser and use proper risk management.
Entry for selling area 1045
SL will be 1082 (37-38 Point)
Target will be 927 (108 Point) / 890 (155 Point) / 808 (236 Point)
Risk and Reward will be 1.6
--------------------------------------------------------------------------------------------------------------------------------------------------------------------------
We are not a financial advisor and you should not construe any information discussed herein to constitute investment advice
This only for study purpose.
--------------------------------------------------------------------------------------------------------------------------------------------------------------------------
Thank you
Trading Cafe 24


TATA CHEMICAL Strong support zone is 780 and nearly Resistance is 1055 can take trade if price comes any of this two level.


TATACHEM- Bearish Momentum ShortTatachem reversed from a strong resistance level and also trendline is broken, and consolidated after the broken line. and showing a high probability to keep momentum downside.
Entry Level:- Below @927
Stop Loss:- Above @935
Target:- 1:1 or 1:2

tata chemical is a good buy at CMP with stop loss of 1019tata chemical is sustaining at current levels, stop loss is 1019 and target is 1120++
