SEND TATA CHEMICALS BACK TO ₹510Volume Profile has been an excellent indicator for the S/R
Price pump in 30 days to the tune of 67% from Feb21-Mar21 within 30 days!
Expecting a similar drawdown soon.
Volume precedes price, and it's coming down fast. NSE:TATACHEM
TATACHEM trade ideas

Tata ChemicalsStock break the Trendline and now trading above the Trendline after retest
Also Bullish Flag pattern Breakout is there .
Can go long here with SL 712 for the target 760 796

Tata Chemicals BUYTata Chemical trend line break .
Good point of entry
T1 :- 785
T2 :- 830
T3 :- 850


TatachemTrend line break plus retest done
Trading above avwap
Follow bottom trendline as SL
Just for education


Tata Chemicals swing buying sideTata Chemicals
BUY = 749
STOP LOSS = 727.70
TARGET = 791.10
Don't just trade on my strategy first backtest ant then trade on your own risk and i am not responsible for any loss

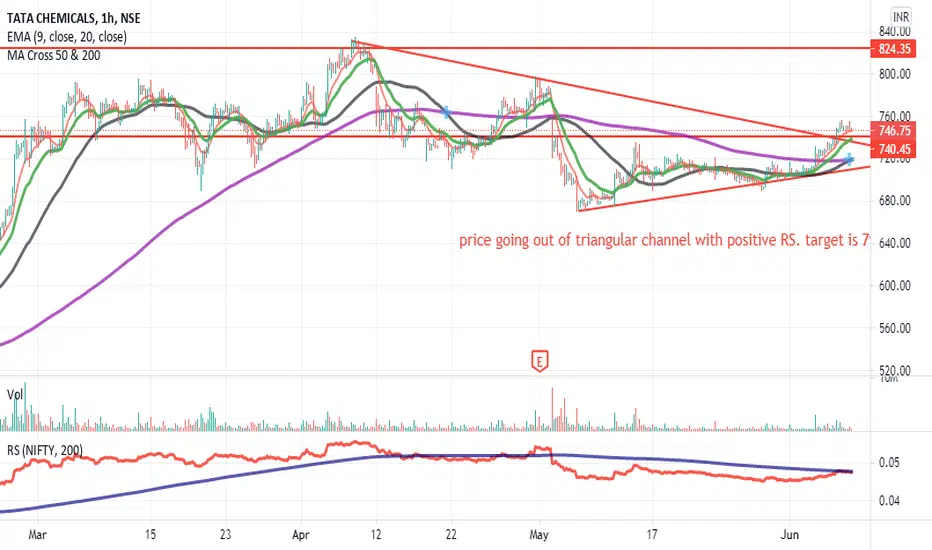
Tata Chemicals - Triangulation Break OutTATACHEM - Looking to breakout from the triangle. 825+ Target SL - 720. A Good RR possible.
DISC: Not a SEBI Registered. I post charts for my own study.

Tata Chemical : Elliott Wave AnalysisTata Chemical seems to have completed its Wave 4 correction and now it might be going for Wave 5. Wave retracement is between 0.236 and 0.382. If we analyze the Wave 4 correction in details it looks like a Zigzag where Wave b has retraced around 0.618 and Wave c has extended exactly around 100% of Wave a. And now the price is above the DMA lines which gives a reasonable surety of correction being over. If the analysis is proven correct we may see minimum 920 levels and if get extension 980-1000 is possible. Invalidation level is 670

Bullish on Tata chemicalsTata chemicals just broke the dynamic resistance and probably it will move toward the all time high... fundamentals are really strong for this company... pitrosky score is 7


TATA CHEMICALS -DOUBLE BOTTOM BREAKOUTChart is looking nice, price forms a double bottom which took a support from a trend line and moving towards the upper trendline.
Once the breakout done then we can go for long in this stock.


TATA CHEMICALSTATA CHEMICALS, near trendline, after breakout going to fly.
Once breakout done, enter on buy side.

AV momentumThis indicator are used for momentum trading in any timeframe..
When yellow colour happened it means market in up trend and pink colour start it means down trend start...

TATA CHEMICALSeems like Tata chemicals breaks triangle pattern and take support to restart rally
This post for educational purpose alone.

TATACHEM ::: HIGH RISK BULLISH TRADEH I G H R I S K T R A D E.
10 MAY 2021
INSTRUMENT: TATACHEM
TREND: BUY
TIME FRAME: DAY
CMP: 683.80
BUY ABOVE: 697
STOP LOSS: 681
TGT 01: 730
DISCLAIMER:
We are not S E B I registered analysts. Please consult your personal financial advisor before investing. We are not responsible for your profits/losses whatsoever.
