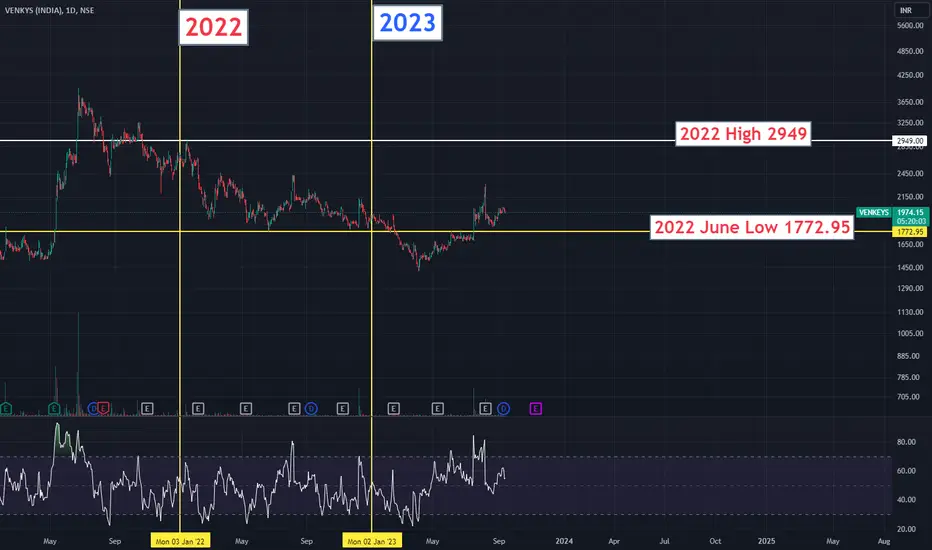
VENKEYS: Macro HVF Wedge Breakout ... coming soon. 🍗 🍗 🍗
🎯 Executive Summary
Venky's (India) Limited (NSE:VENKEYS) is setting up for one of the most asymmetric macro structural reversals on the entire exchange.
After grinding through a massive 9-year symmetrical consolidation wedge, the price action is converging with an undeniable fundamental inf
Venky's (India) Limited
No trades
No trades
Compare with Venky's (India) Limited
123.1 INR
1.39 B INR
37.27 B INR
5.27 M
Next report date
—
Report period
—
EPS estimate
—
Revenue estimate
—
Company info
Sector
Industry
CEO
Balaji Rao Banda
Website
Headquarters
Pune
Founded
1976
IPO date
Jul 22, 1995
ISIN
INE398A01010
FIGI
BBG000D25FJ1
Identifiers
ISIN INE398A01010
Venky's India Ltd. engages in the production and sale of poultry products. It operates through the following segments: Poultry & Poultry Products, Animal Health Products, and Oilseed. The Poultry & Poultry Products segment produces and sells chicks, grownup commercial broiler and layer, processed chicken, specific pathogen free eggs, poultry feed and other miscellaneous poultry products. The Animal Health Products segment offers medicines and other health products for birds. The Oilseed segment provides edible refined soya oil and soya de-oiled cake. The company was founded in 1976 and is headquartered in Pune, India.
VENKYSVenky’s (India) Ltd. (CMP ₹1,577.10, -2.14%), headquartered in Pune, is India’s leading poultry and animal health company. Incorporated in 1976, Venky’s operates across poultry breeding, processed chicken, animal feed, and pharmaceutical products. It is also known for producing pathogen-free eggs us
Venky's still have downside?I am looking it at the Monthly level - you can see the price inside the Big Triangle.
Currently price is completing the second leg of the Triangle zig-zag.
If my assumption is right, there is still room for 30-35% downside, until it hits the lower wall of the Triangle.
Venky's being one of the
Comprehensive Analysis of VENKEYS (NSE: VENKEYS)Technical Overview:
1. Doji on Rising Trendline:
The weekly chart for VENKEYS reveals a Doji candlestick pattern occurring at a rising trendline. A Doji signals market indecision and potential trend reversal. In the context of a rising trendline, it suggests a point of equilibrium between buyer
See all ideas
Summarizing what the indicators are suggesting.
Oscillators
Neutral
SellBuy
Strong sellStrong buy
Strong sellSellNeutralBuyStrong buy
Oscillators
Neutral
SellBuy
Strong sellStrong buy
Strong sellSellNeutralBuyStrong buy
Summary
Neutral
SellBuy
Strong sellStrong buy
Strong sellSellNeutralBuyStrong buy
Summary
Neutral
SellBuy
Strong sellStrong buy
Strong sellSellNeutralBuyStrong buy
Summary
Neutral
SellBuy
Strong sellStrong buy
Strong sellSellNeutralBuyStrong buy
Moving Averages
Neutral
SellBuy
Strong sellStrong buy
Strong sellSellNeutralBuyStrong buy
Moving Averages
Neutral
SellBuy
Strong sellStrong buy
Strong sellSellNeutralBuyStrong buy
Displays a symbol's price movements over previous years to identify recurring trends.
Frequently asked questions
The current price of VENKEYS is 1,531.0 INR — it has increased by 0.33% in the past 24 hours. Watch Venky's (India) Limited stock price performance more closely on the chart.
Depending on the exchange, the stock ticker may vary. For instance, on NSE exchange Venky's (India) Limited stocks are traded under the ticker VENKEYS.
VENKEYS stock has fallen by −2.12% compared to the previous week, the month change is a 1.33% rise, over the last year Venky's (India) Limited has showed a 6.92% increase.
VENKEYS reached its all-time high on Apr 9, 2018 with the price of 4,725.0 INR, and its all-time low was 32.8 INR and was reached on Jul 27, 2004. View more price dynamics on VENKEYS chart.
See other stocks reaching their highest and lowest prices.
VENKEYS stock is 2.14% volatile and has beta coefficient of 1.57. Track Venky's (India) Limited stock price on the chart and check out the list of the most volatile stocks — is Venky's (India) Limited there?
Today Venky's (India) Limited has the market capitalization of 21.52 B, it has decreased by −0.04% over the last week.
Yes, you can track Venky's (India) Limited financials in yearly and quarterly reports right on TradingView.
Venky's (India) Limited is going to release the next earnings report on Nov 5, 2026. Keep track of upcoming events with our Earnings Calendar.
VENKEYS net income for the last quarter is 499.90 M INR, while the quarter before that showed 1.01 B INR of net income which accounts for 0.00% change. Track more Venky's (India) Limited financial stats to get the full picture.
Yes, VENKEYS dividends are paid annually. The last dividend per share was 10.00 INR. As of today, Dividend Yield (TTM)% is 0.65%. Tracking Venky's (India) Limited dividends might help you take more informed decisions.
EBITDA measures a company's operating performance, its growth signifies an improvement in the efficiency of a company. Venky's (India) Limited EBITDA is 2.38 B INR, and current EBITDA margin is 5.15%. See more stats in Venky's (India) Limited financial statements.
Like other stocks, VENKEYS shares are traded on stock exchanges, e.g. Nasdaq, Nyse, Euronext, and the easiest way to buy them is through an online stock broker. To do this, you need to open an account and follow a broker's procedures, then start trading. You can trade Venky's (India) Limited stock right from TradingView charts — choose your broker and connect to your account.
Investing in stocks requires a comprehensive research: you should carefully study all the available data, e.g. company's financials, related news, and its technical analysis. So Venky's (India) Limited technincal analysis shows the buy rating today, and its 1 week rating is buy. Since market conditions are prone to changes, it's worth looking a bit further into the future — according to the 1 month rating Venky's (India) Limited stock shows the neutral signal. See more of Venky's (India) Limited technicals for a more comprehensive analysis.